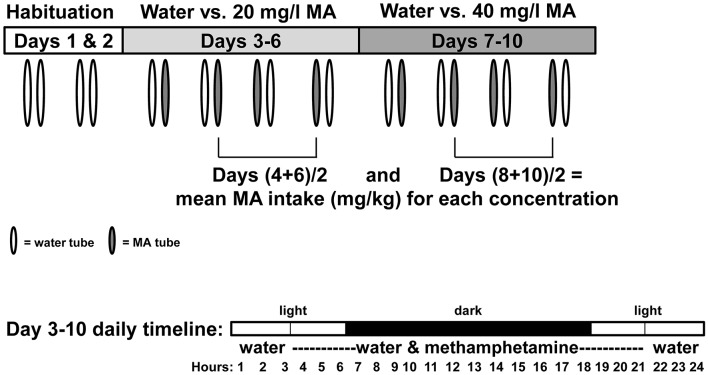
Figure 1.
Diagram illustrating procedure for measuring two-bottle choice MA drinking. Mice were isolate-housed and given access to two, 25-ml graduated cylinders fitted with stoppers and sipper tubes for a 10-d period. On days 1 and 2, the tubes were filled with water. Mice were then given a choice between water and a solution of 20 mg MA/l tap water on days 3–6, and then 40 mg MA/l water on days 7–10. The MA tube was available for 18 h per day, beginning 3 h before the dark phase and ending 3 h into the light phase, as shown in the day 3–10 daily timeline. During the remaining 6 h, one tube containing water was available. The relative positions of the water and MA tubes on each day are indicated by tube coloration. Day 4 and 6 consumption values were averaged for each mouse and used to derive a mean MA intake value for the 20 mg/l concentration; Day 8 and 10 consumption values were averaged for each mouse and used to derive a mean MA intake value for the 40 mg/l concentration.

