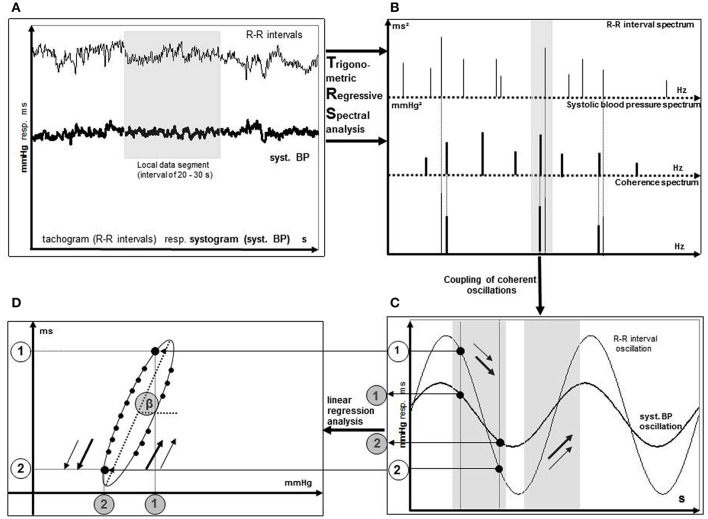
Figure 1.
Illustration of the BRS calculation process using TRS. Spontaneous oscillations of RR intervals and systolic blood pressure (A) are replaced by theoretical TRS oscillations (B). Calculation of BRS as the slope of the regression line (D) originates from coherent oscillation pairs of RR interval and systolic blood pressure (C). Points 1 and 2 are two examples of coherent oscillation pairs of RR intervals and systolic blood pressures. [Taken from Gasch et al. (2011)].

