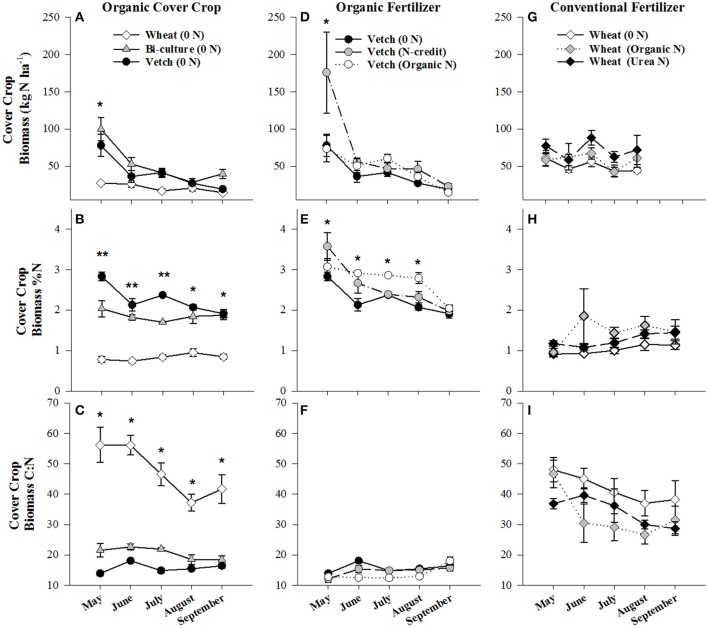
Figure 1.
Average (±SE) aboveground cover crop biomass residue N content (kg N ha−1), %N, and C:N ratio harvested from the soil surface from May to September 2014 in the organic cover crop treatments (A–C), the organic N-fertilizer treatments (D–F), and the conventional N-fertilizer treatments (G–I). Asterisks indicate points in time where significant effects between treatments were observed and double asterisks indicated points in time where all treatments significantly differed from one another. Cover crop species are indicated in the legends, where 0 N = no applied fertilizer, fertilizer N-credit = 56 kg ha−1 organic fertilizer+additional hairy vetch, Organic N = 168 kg ha−1 organic fertilizer, Urea N = 168 kg ha−1 urea+urease inhibitor.

