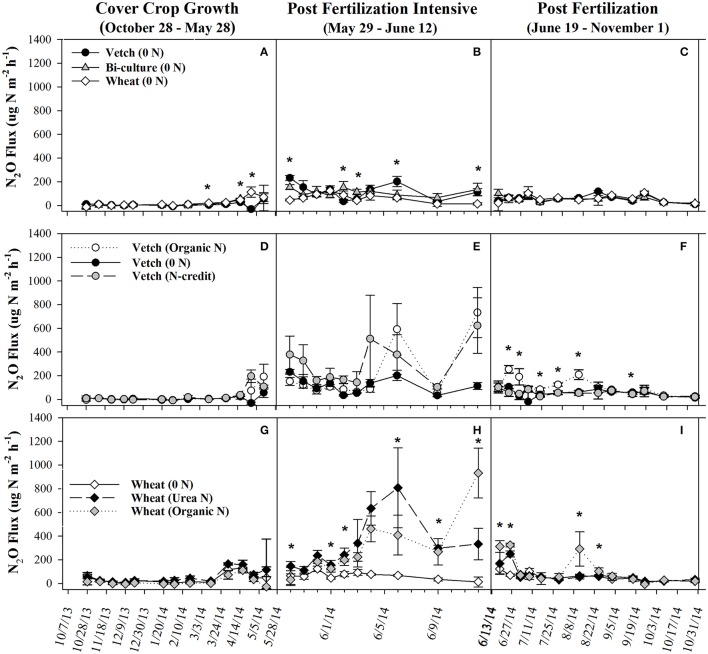
Figure 3.
Average (±SE) N2O flux for organic cover crop treatments (A–C), organic N-fertilizer treatments (D–F), and conventional N-fertilizer treatments (G–I) across three different time periods (twice a month during the cover crop growth period, daily to every other day after fertilizer was applied and, after fluxes from fertilized treatments appear similar to unfertilized treatments, every 7–10 days during corn growth) from October 2013 to November 2014. Asterisks indicate points in time where significant effects between treatments were observed during the measurement period. Cover crop species are indicated in the legends, where 0 N = no applied fertilizer, fertilizer N-credit = 56 kg ha−1 organic fertilizer+additional hairy vetch Organic N = 168 kg ha−1 organic fertilizer, Urea N = 168 kg ha−1 urea+urease inhibitor.

