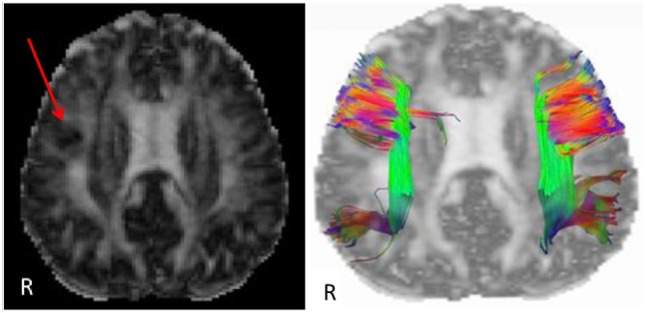
Figure 2.

Reconstructed generalized fractional anisotropy (gFA) (left) of subject with a red arrow pointing to white matter disruption with relatively lower gFA of the right frontal lobe. A tractogram overlaid on gFA (right) of the superior longitudinal fasciculus shows sparser tract density on the right compared with left side. Colors indicate fiber tract orientation, or directionality, such that green is anterior–posterior, red is left–right, and blue is superior–inferior.
