Figure 1.
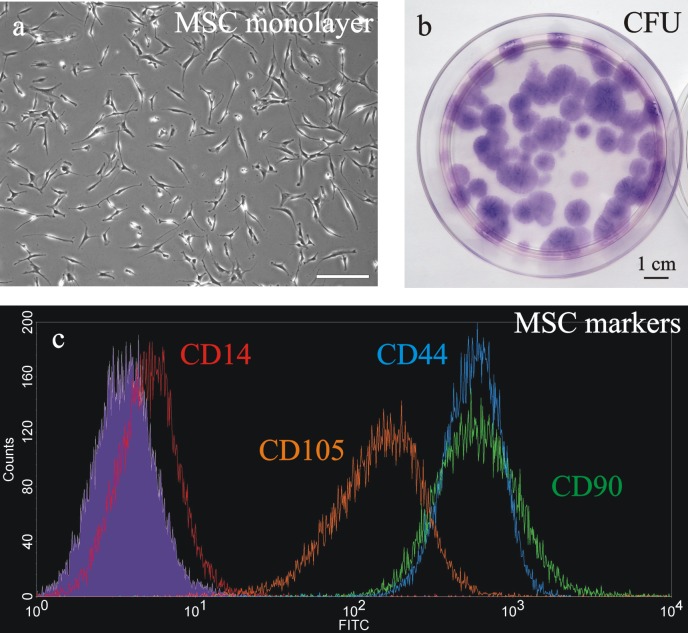
MSC characterization was based on their peculiar fibroblast-like morphology (a, entire scale bar is 200 μm), ability to form colonies (stained with Giemsa; b) and expression of the positive markers CD44 (blue line), CD90 (green line), CD105 (orange line) and the negative marker CD14 (red line), tested by flow cytometry analysis (grey line = unstained control; c).

