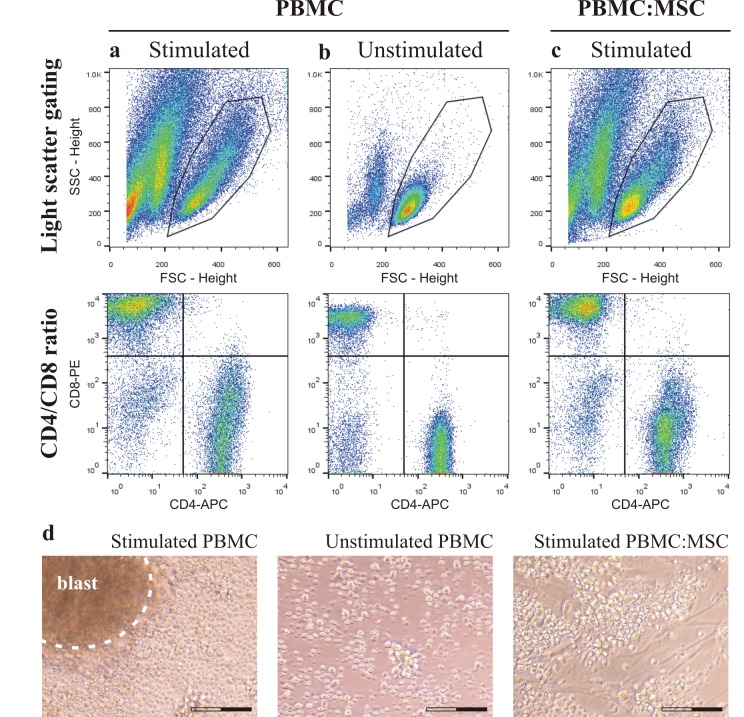
Figure 3.
After seven days culture, stimulated (column a) and unstimulated (column b) PBMC, and stimulated PBMC (column c), isolated from co-culture with MSC, were morphologically characterized. Images from a representative sample show light scattered gating of cells (side scatter, SSC, and forward scatter, FSC; top row) and CD4/CD8 ratio of T-cells (middle row). On the bottom (d), microphotographs taken after three days show the presence or lack of lymphocyte blast formation in the same samples (entire scale bar is 100 μm).

