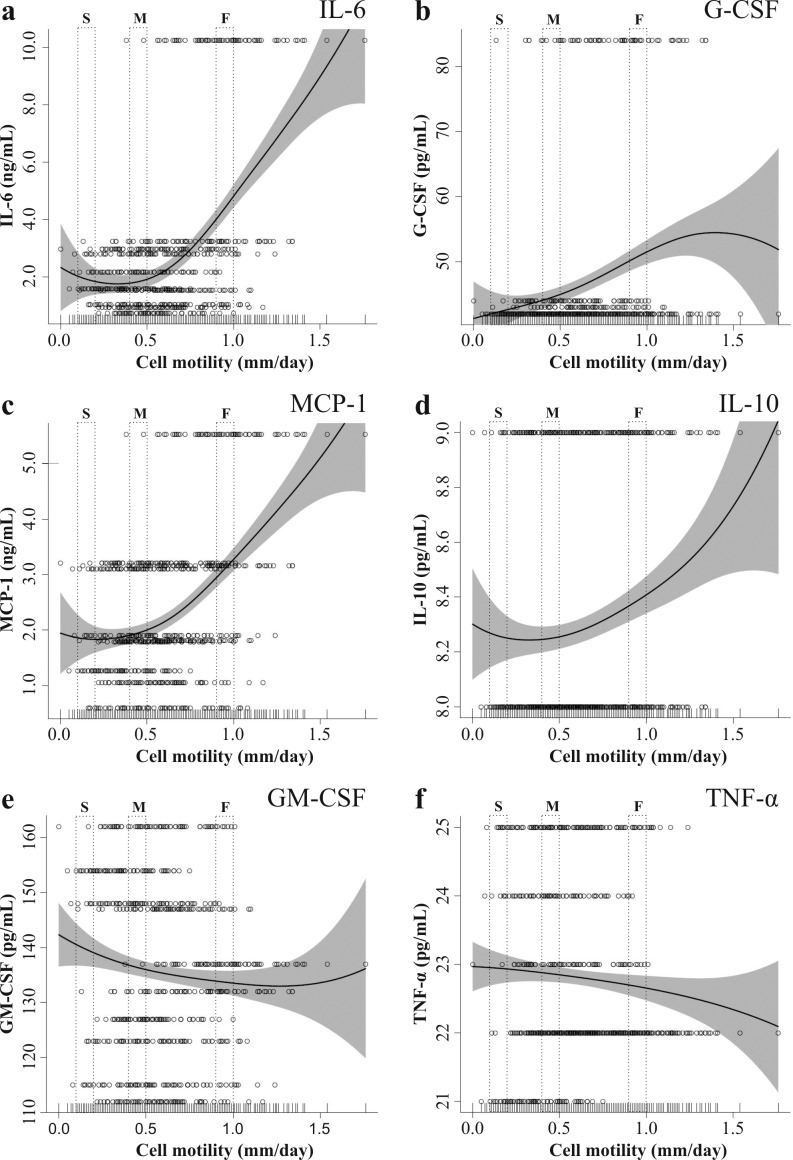
Figure 7.
MSC monoculture concentration of IL-6 (a), G-CSF (b), MCP-1 (c), IL-10 (d), GM-CSF (e) ) and TNF-α (f) plotted against cell motility. Each row (70 cells) represents a MSC population. Abbreviations: O = single cells; — = penalized spline smoother; grey area = confidence band. (S = slow, M = middle, F = fast moving cells)

