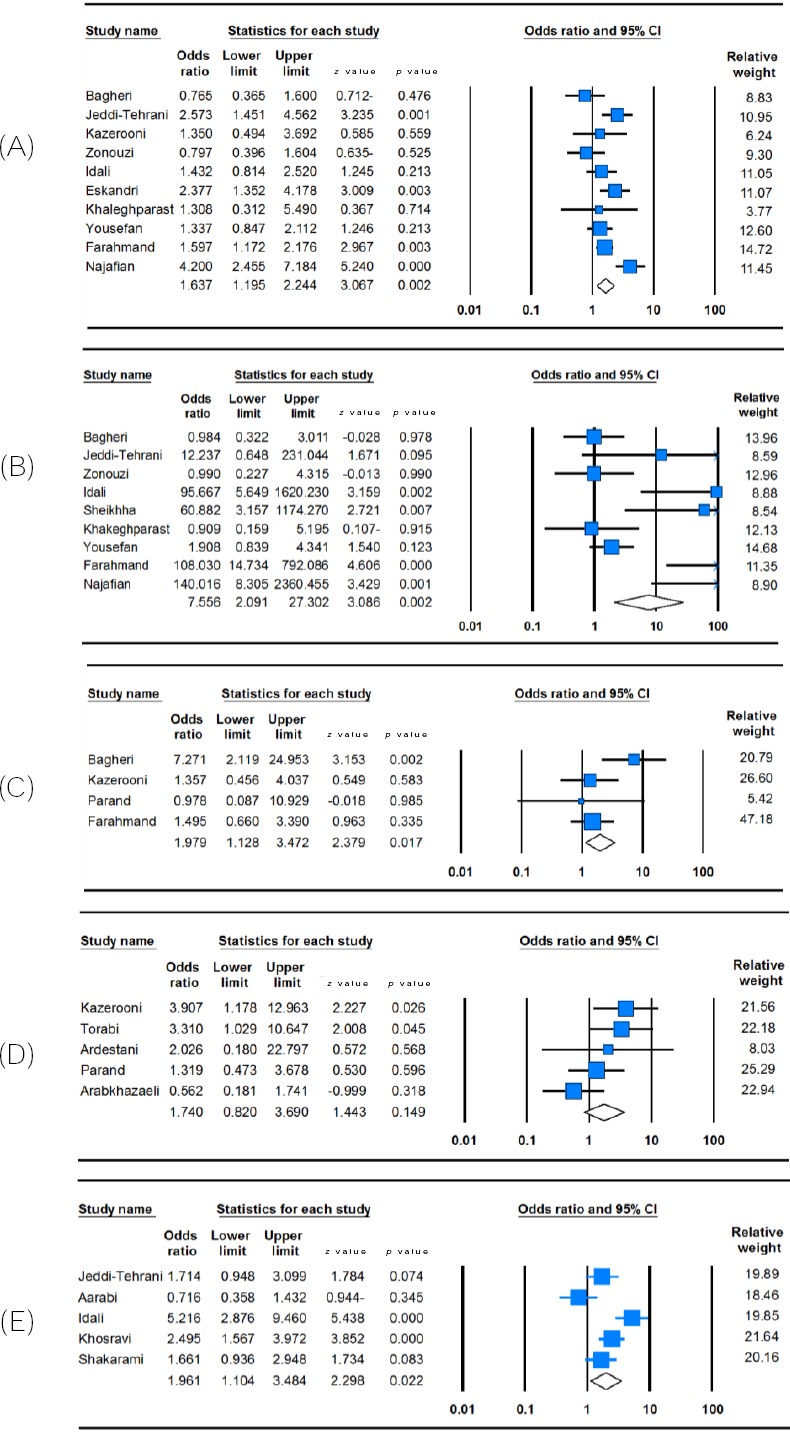
Fig. 1.

Forest plot of RPL susceptibility associated with thrombophilic genes polymorphisms. (A) MTHFR C677T (dominant model: TT + CT vs. CC); (B) MTHFR A1298C (homozygote model; AA vs. CC); (C) Prothrombin G20210A (allele model; A vs. G); (D) FVL G1619A (heterozygote model: GA vs. GG), and (E) PAI-1 4G/5G (dominant model: 4G/4G + 4G/5G vs. 5G/5G). For each study, the estimation of OR and its 95% CI are plotted with a square and a horizontal line. A diamond indicates the pooled OR with 95% CI.
