
Fig. 2.
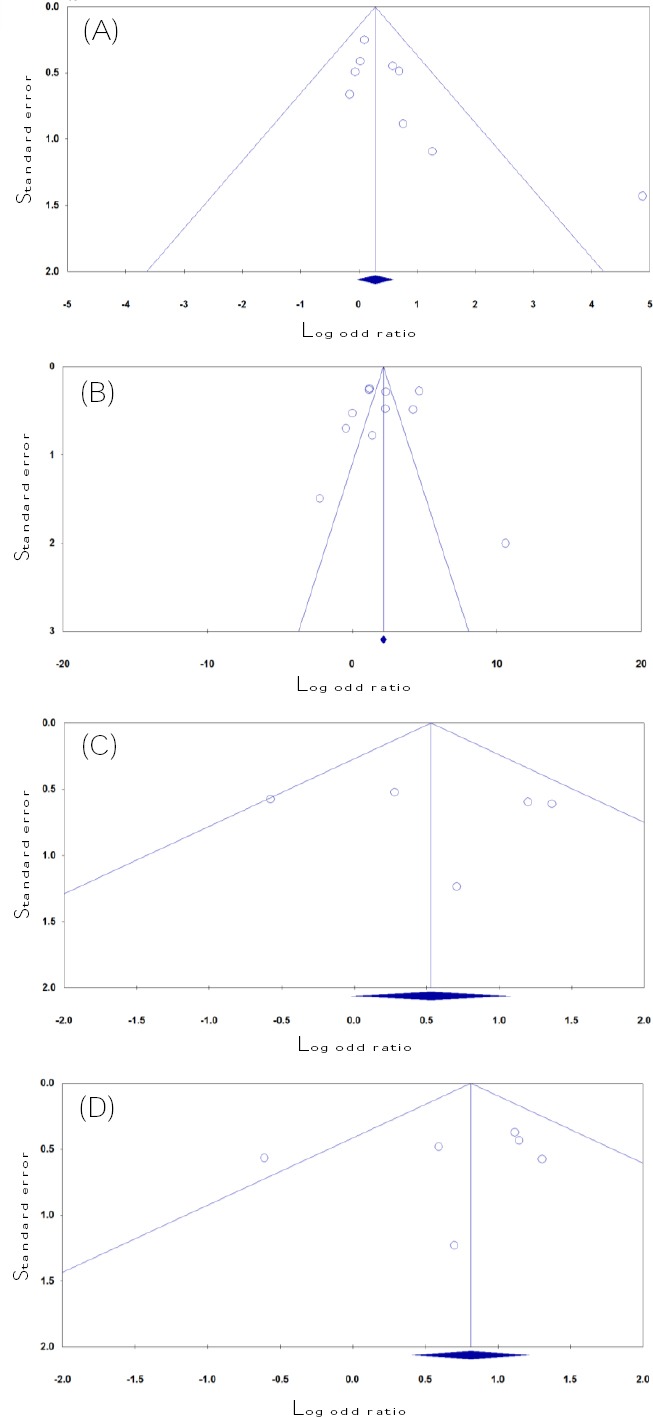
Begg’s funnel plots for thrombophilia gene polymorphisms and RPL risk in the Iranian patients to test the publication bias. (A) MTHFR C677T (recessive model: TT vs. CT + CC); (B) MTHFR A1298C (dominant model: AA vs. AC + CC); (C) Prothrombin G20210A (dominant model: AA + GA vs. GG); (D) FVL G1691A (allele model: A vs. G). Each point represents a separate study for the indicated association.