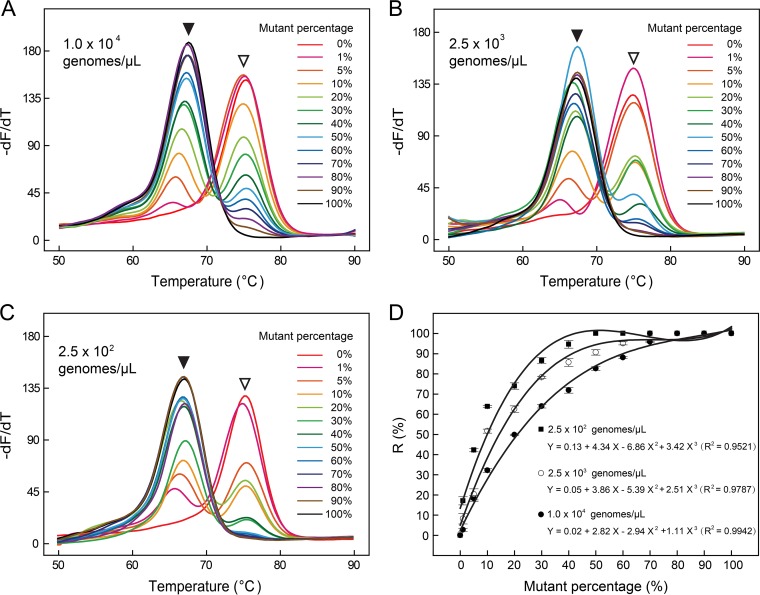
FIG 3.
Melting curve analysis for detecting katG S315T of three different total DNA concentrations, i.e., 104 (A), 2.5 × 10³ (B) and 2.5 × 10² (C) genomes/μl. Open and filled arrowheads point to wild-type and mutant melting peaks, respectively. The calculated R values were plotted with respect to the mutant percentage (D), where solid circles, hollow circles, and solid squares represented 104, 2.5 × 10³ and 2.5 × 10² genomes/μl, respectively.

