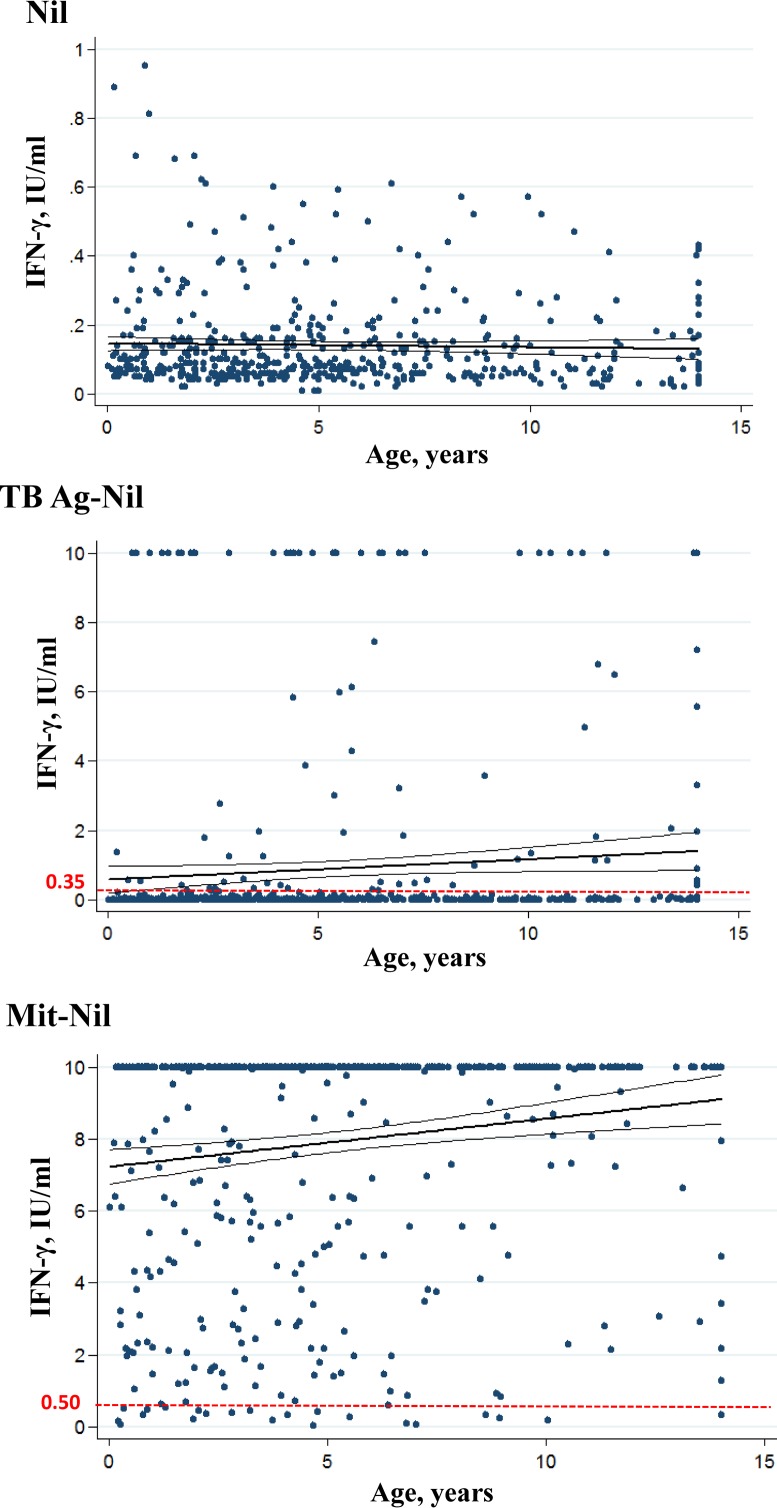
FIG 2.
IFN-γ quantitative values in QFT-IT tubes according to age. Individual IFN-γ levels in background (nil), in response to nil-corrected M. tuberculosis antigens (TB Ag), and nil-corrected mitogen are plotted by age. The cutoff values for positive and indeterminate QFT-IT are represented by red dotted lines at 0.35 and 0.50 IU/ml, respectively. The bold lines indicate the linear regressions. The thinner lines indicate the 95% confidence intervals. For graphical reason nil values higher than 1 IU/ml (n = 12) were not reported.

