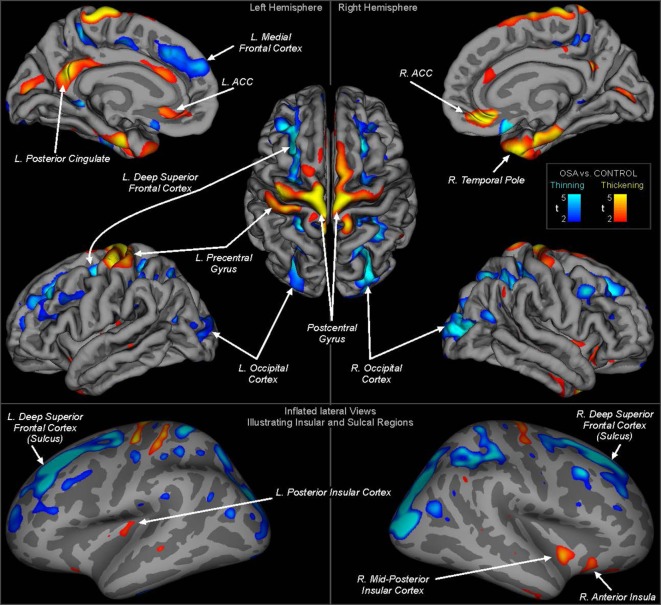
Figure 1.
Regions of significant cortical thickness differences between obstructive sleep apnea and controls (FDR ≤0.05). Areas are color-coded according to significance level (t-statistic), with cool colors representing thinning and warm colors thickening (see scale). The top panels show regions overlaid onto the pial surface (gray matter boundary) for clear visualization of structures and gyral differences. The lower panel shows regions overlaid onto an inflated view, whereby all regions including sulci and the insular cortices are visible. Light gray shading represents gyral and dark gray sulci. ACC, anterior cingulate cortex. Quantitative measures for each region are shown in Tables 2 and 3.

