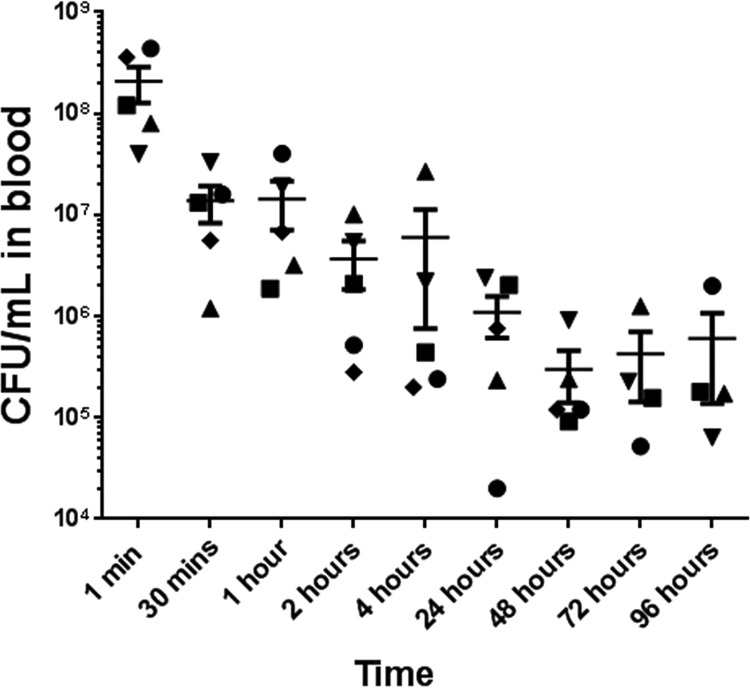
FIG 3.
Bacterial load in blood at different time points after infection. Blood samples were drawn at different time points from rats challenged with 109 CFU of MRSA USA300 per animal to determine bacterial counts, expressed as the mean CFU/ml ± the SE in individual animals. Each animal is represented by a different shape. n = 4/group at 72 and 96 h; n = 5/group at all other time points.

