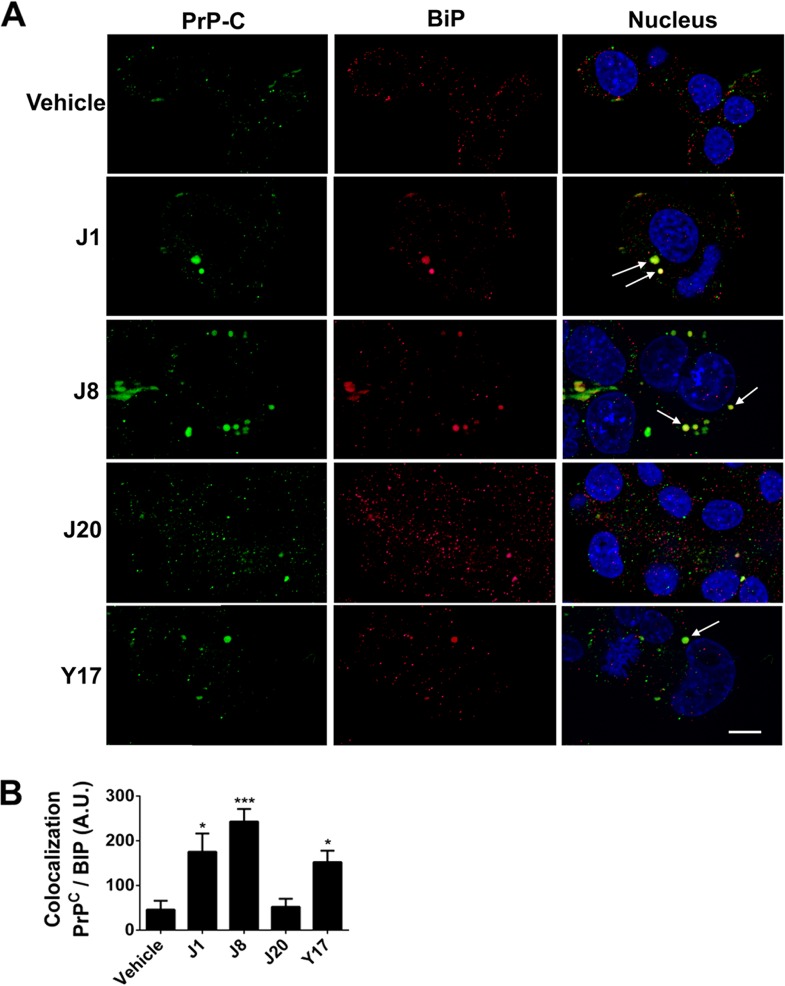
FIG 10.
PrPC neuronal location after test compound treatment. (A) Representative fields of images from structured illumination confocal immunofluorescence analysis of PrPC (green) and BiP (red) cellular colocalization in mouse neuroblastoma N2a cells treated with 10 μM test compounds (J1, J8, J20, and Y17) or 0.1% DMSO (vehicle). Arrows, areas of PrPC and BiP colocalization, indicating PrPC arrest at the endoplasmic reticulum. The nuclei were stained with DAPI (blue). Bar, 10 μm. (B) Colocalization analysis was performed with ImageJ software. Twenty fields with more than 30 cells each were analyzed per condition. One-way ANOVA was performed. Error bars indicate standard errors of the means (SEM). *, P < 0.05 relative to the control; ***, P < 0.001 relative to the control.

