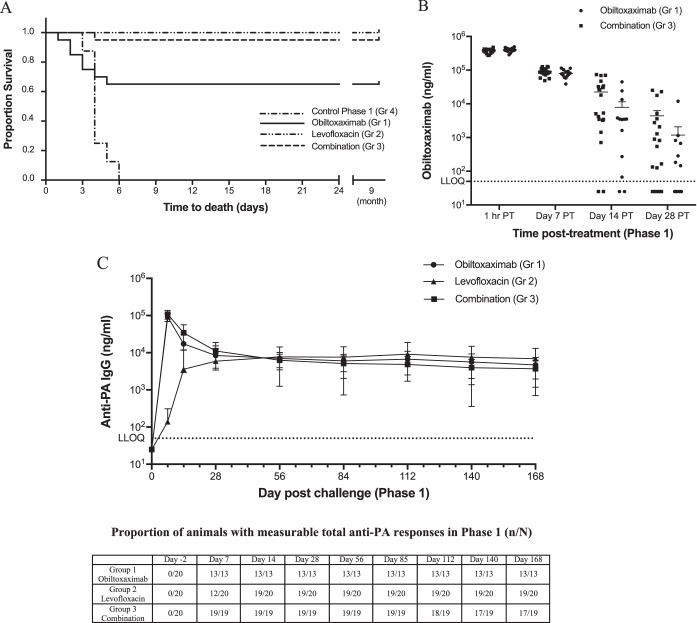
FIG 1.
Kinetics of anti-PA antibodies in challenged and treated animals. NZW rabbits were aerosol challenged with targeted 200 LD50 of B. anthracis spores and treated with obiltoxaximab (circles), levofloxacin (triangles), or a combination of both (squares) at 30 h PC. (A) Kaplan-Meier curves representing time to death from challenge and survival data for each group are shown. (B and C) Serum samples were collected at the indicated times relative to treatment (posttreatment [PT]) or challenge for a specific assessment of obiltoxaximab (B) or nonspecific assessment of all circulating anti-PA IgGs (C). (A) Each symbol represents individual animal values. (B) Vertical lines indicate means and standard error for each group at each indicated time point. (C) Vertical lines indicate means and standard deviations for each group at each indicated time point. Numbers of animals with measurable total anti-PA IgG levels (n) and the total numbers of animals surviving to each time point (N) are shown on the bottom. Total anti-PA pool is composed of endogenous rabbit antibodies to PA as well as circulating obiltoxaximab. Dotted lines indicate lower limit of quantitation for each assay. For statistical computations, levels below limit of detection were replaced with ½ LLOQ. The LLOQ was 50 ng/ml in each assay.

