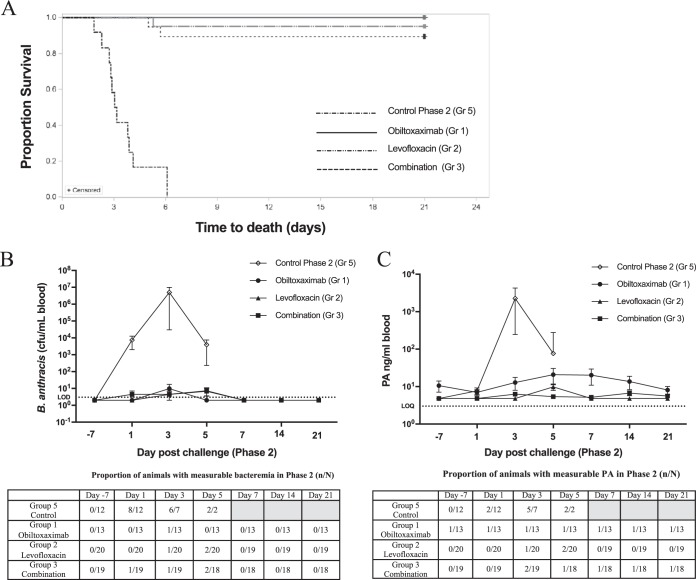
FIG 3.
Survival and systemic disease development in immune animals following rechallenge. Nine months after primary challenge, phase 1 survivors and 12 additional naive controls were challenged with targeted 200 LD50 of B anthracis spores and monitored for 21 days. (A) Kaplan-Meier curves representing time to death from challenge and survival data for each group are shown. (B and C) Whole-blood samples were collected prior to treatment (day [D] −7) or at indicated times postrechallenge (PC) for the assessment of quantitative bacteremia (B) and circulating free PA (C). Shown are the means and standard error of the mean (SEM) for bacteremia and free PA at each indicated time point. Dotted lines represent limit of detection (LOD) for bacteremia or limit of quantitation (LOQ) for PA. Numbers of animals with measurable levels for each parameter (n) and the total numbers of animals surviving to each time point (N) are indicated at the bottom. Shaded areas indicate that no animals survived to that time point. For statistical computations, bacteremia levels below the LOD were replaced with 2 CFU/ml (½ LOD), and PA levels below limit of quantitation (LOQ) were replaced with 4.84 ng/ml (½ LOQ).

