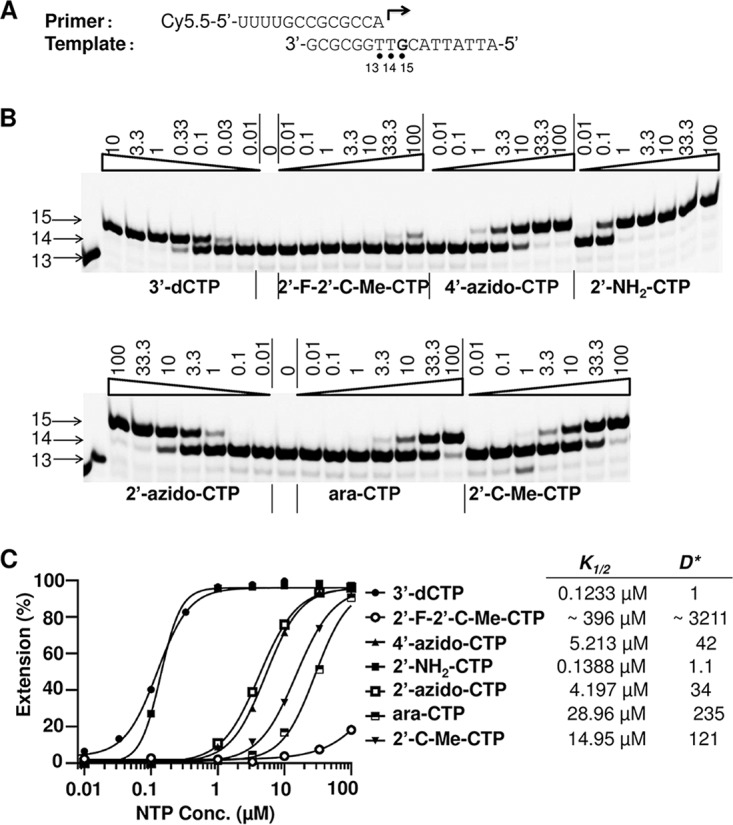
FIG 7.

Measurement of the discrimination values of the CTP analogs. (A) The primer and template used to assay the CTP analogs. (B) A representative image of the results of the analysis of the CTP analogs. Primer extension reaction mixtures contained 10 nM P/T and 20 nM POLRMT, and the reactions were performed in the presence of 1 μM ATP as the first ribonucleotide and increasing concentrations (in micromolar) of 3′-dCTP or CTP analogs, as indicated above each lane. The reactions were performed at 22°C for 30 min, and the products were resolved by denaturing PAGE. The identity of the tested ribonucleotide is indicated at the bottom of the gel. The migrations of the 13-mer primer and the 14- and 15-mer first and second ribonucleotide extension products, respectively, are indicated on the left. (C) Quantitative analysis of CTP analogs and 3′-dCTP incorporation. The incorporation efficiency was evaluated on the basis of the extension of 14-mer to 15-mer products. The measured K1/2 values are shown on the right of the graph. The discrimination between CTP analogs and 3′-dCTP was calculated as K1/2, analog/K1/2, 3′dCTP, and the values are shown on the right of the graph. The discrimination between CTP analogs and natural CTP was calculated as . D3′-dCTP is 59.7 ± 1.6 (Table 1), so for 2′-F-2′-C-Me-CTP, 4′-azido-CTP, 2′-NH2-CTP, 2′-azido-CTP, ara-CTP, and 2′-C-Me-CTP, the calculated values of in this experiment were 191,696, 2,507, 66, 2030, 14,029, and 7,224, respectively.
