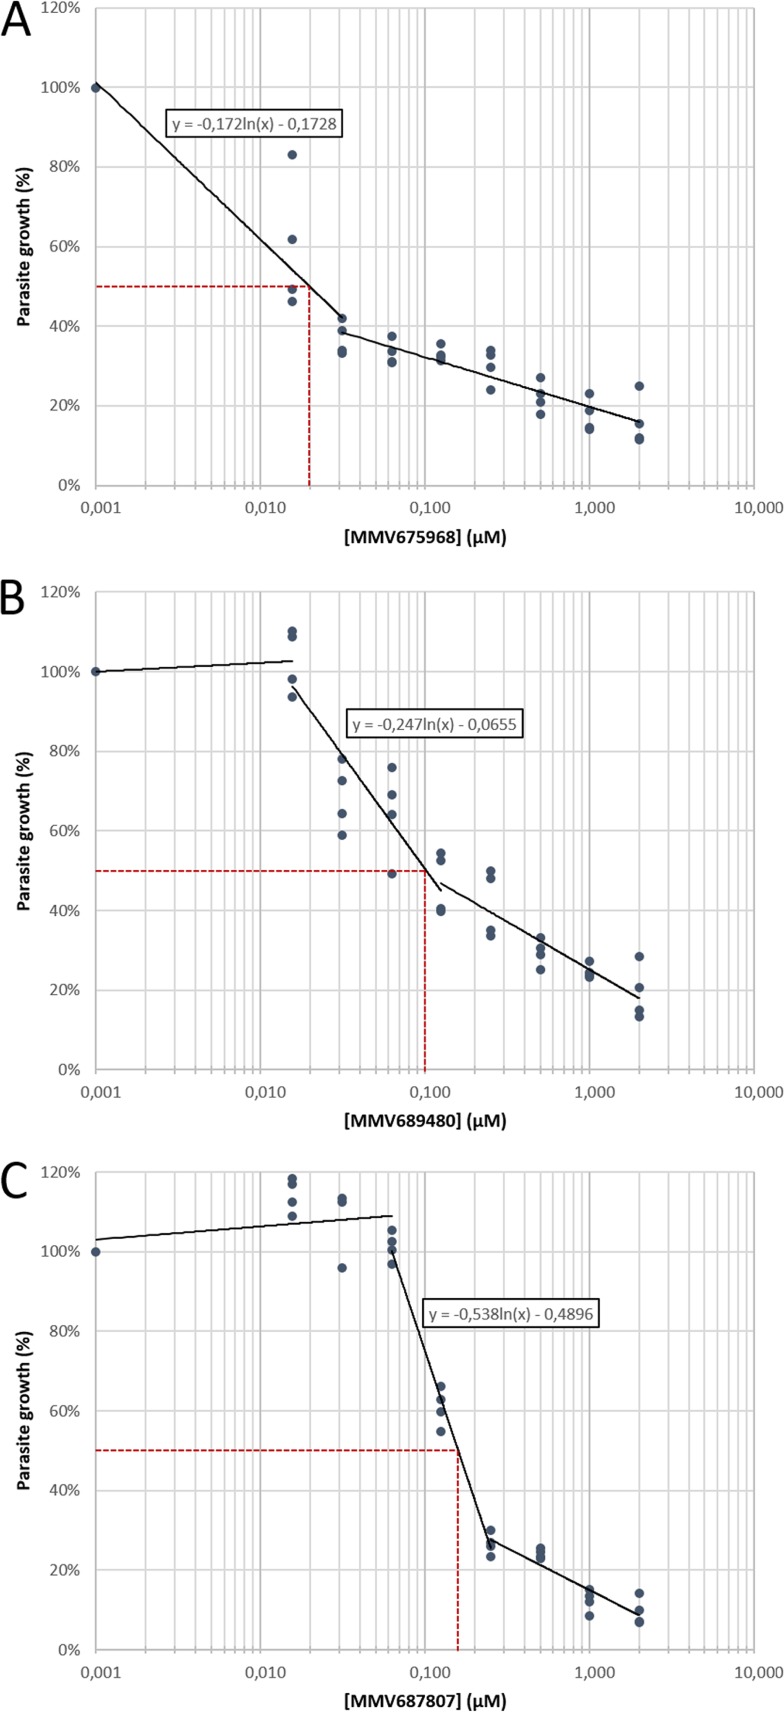
FIG 2.
Representative figures of dose-response curves of the three most active compounds, MMV675968 (A), MMV689480 (B), and MMV687807 (C), against T. gondii. Concentrations ranged from 0 to 2 μM. Results were obtained from two different experiments consisting of two replicates per condition. Each dot represents one replicate value. The dotted line indicates 50% reduction in parasite growth.

