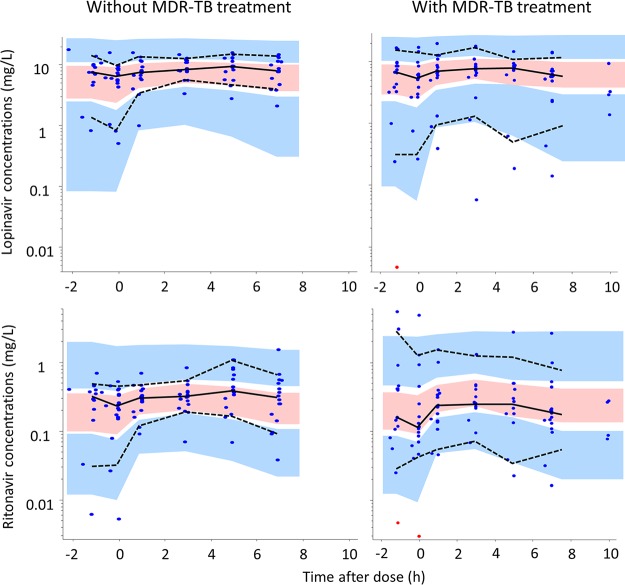
FIG 2.
Visual predictive check of the combined pharmacokinetic model for lopinavir and ritonavir in HIV-infected children stratified by MDR-TB versus controls, using 1,000 simulations. The solid and dashed lines represent the 10th, 50th, and 90th percentiles of the observed data, while the shaded areas (pink and blue) are the model-predicted 90% confidence intervals for the same percentiles. Observed data are displayed as dots, with resimulated censored data points (points at the LLOQ) being indicated in red.

