
FIG 4.
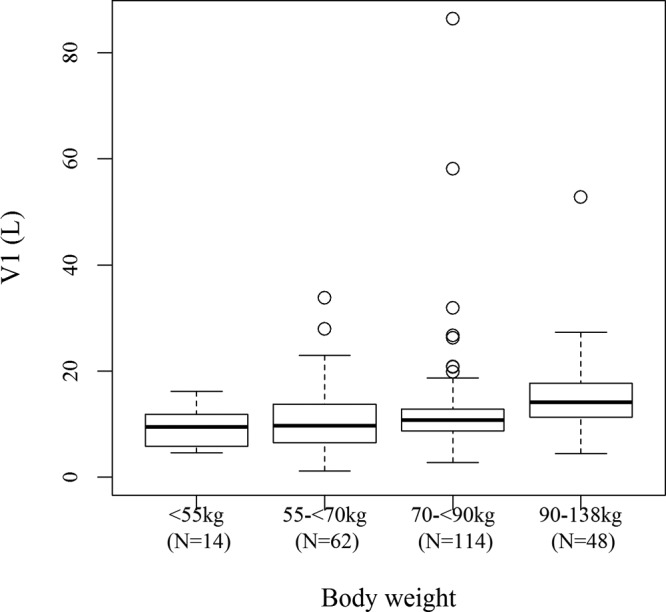
Box plot for individual post hoc V1 for patients with infection by body weight group defined by CLCR. The final model with CLCR was used to estimate individual parameters. Thick center lines, medians; top and bottom lines of the boxes, first and third quartiles (interquartile range), respectively; whiskers, the most extreme data within 1.5× the interquartile range; circles, outliers beyond 1.5× the interquartile range.