
FIG 2.
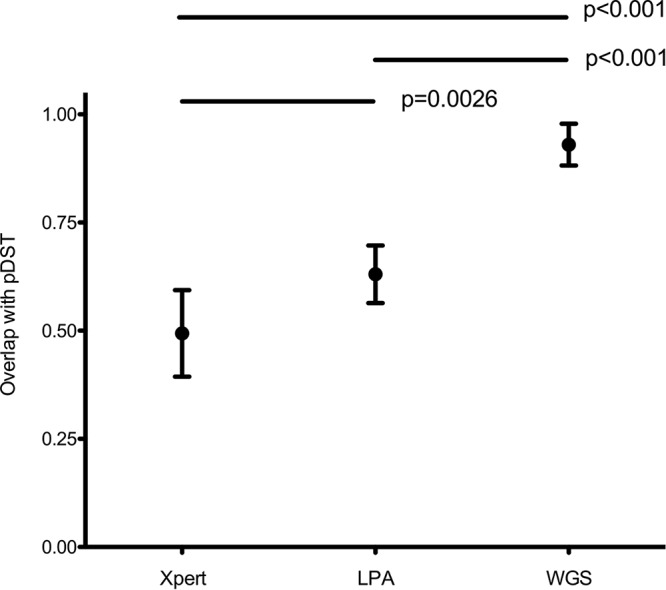
Average overlap of different regimens based on molecular DST assays compared with pDST results. Standard algorithm-derived treatment regimens based on results of Xpert, LPAs, and WGS (x axis) with their mean overlap to standard algorithm-derived treatment regimens based on pDST results (y axis). Mean overlaps (dots) are expressed with 95% confidence intervals (bars). P values assessing the differences between the mean overlaps between the treatment regimens are shown above.