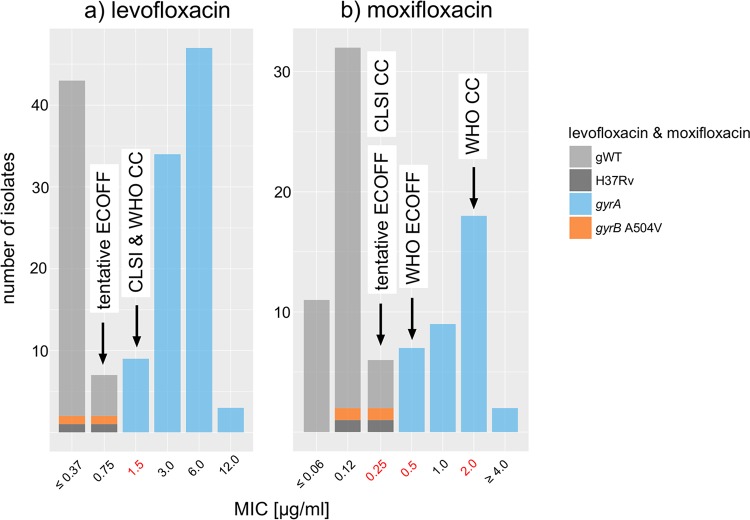
FIG 4.
MIC distributions for levofloxacin and moxifloxacin. The pooled MIC data identified potential breakpoint artifacts for both agents. First, the CLSI and WHO critical concentrations for levofloxacin were one dilution higher than the tentative ECOFF defined in this study (1.5 versus 0.75 μg/ml) (11, 14). Second, the pooled data supported the current CLSI critical concentration (0.25 μg/ml) as the tentative ECOFF for moxifloxacin rather than the value set by WHO (0.5 μg/ml), which is designed as a surrogate for testing resistance to ofloxacin and levofloxacin (24). Moreover, WHO has acknowledged that the critical concentration at 2 μg/ml, which defines resistance to moxifloxacin, may be too high (24). Because two isolates with different genetic backgrounds shared the same gyrB A504V mutations, which is typically a signal of positive selection, these isolates were categorized as unclear. However, MIC testing revealed MICs that were equal to or below even the tentative ECOFFs for both fluoroquinolones, which was in line with allelic exchange experiments (59).

