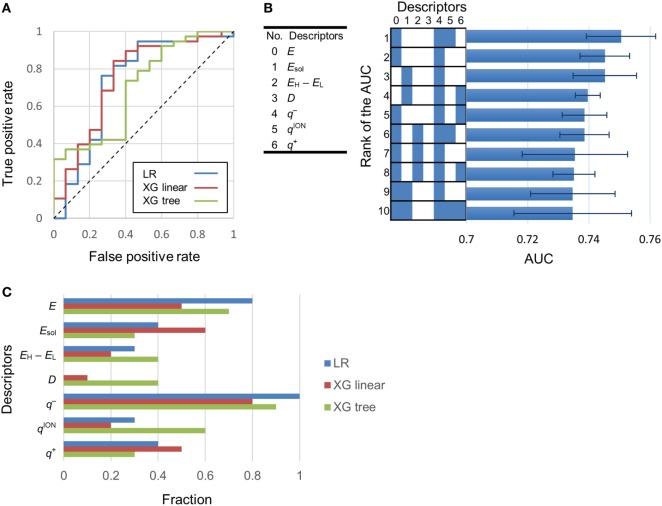
Figure 2.
Determination of the most effective descriptor for classification. (A) Typical receiver operating characteristic (ROC) curves of highest area under the curve (AUC) models. LR, XG linear, and XG tree showed logistic regression, XGBoost (linear model) and XGBoost (tree model). AUC of these ROC curves were 0.73, 0.75, and 0.7, respectively. (B) Left-hand side: serial numbers of the descriptors. Right-hand side: AUC of the top 10 classification models. Descriptors included in a model are labeled blue. Error bars in the right-hand side graph show the SD of the AUC. (C) Fraction of models in which a descriptor is present. A fraction value of 1.0 means that the descriptor was present in all of the top 10 classification models.

