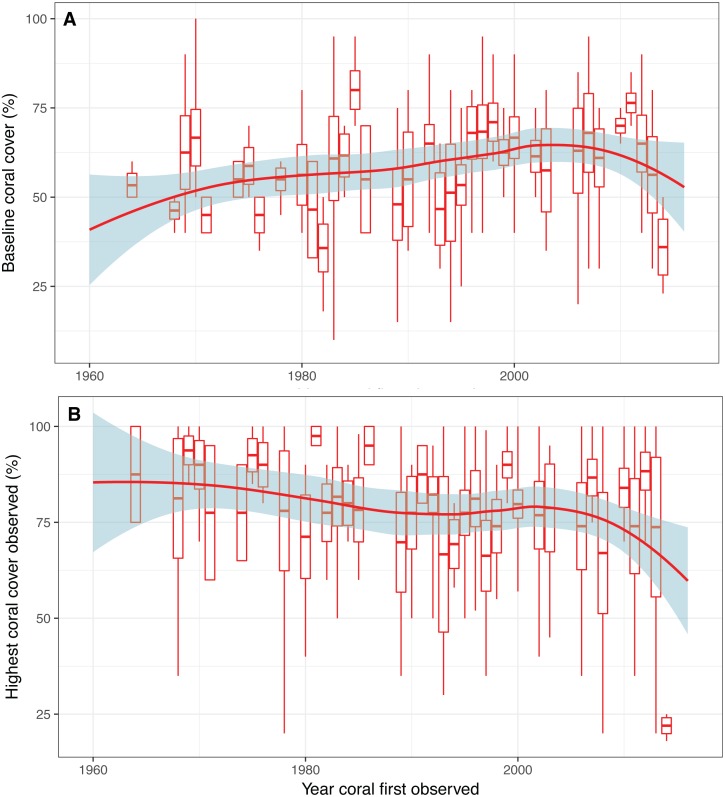
Figure 4. Baseline estimates and highest coral cover observed over time.
(A) Expert opinion estimates of baseline coral cover and (B) highest coral cover observed as a function of the first year that a respondent observed a coral reef. Box plots depict mean with standard error and tails show the minimum and maximum values. Red trend line indicates smoothed conditional mean with confidence interval in blue.

