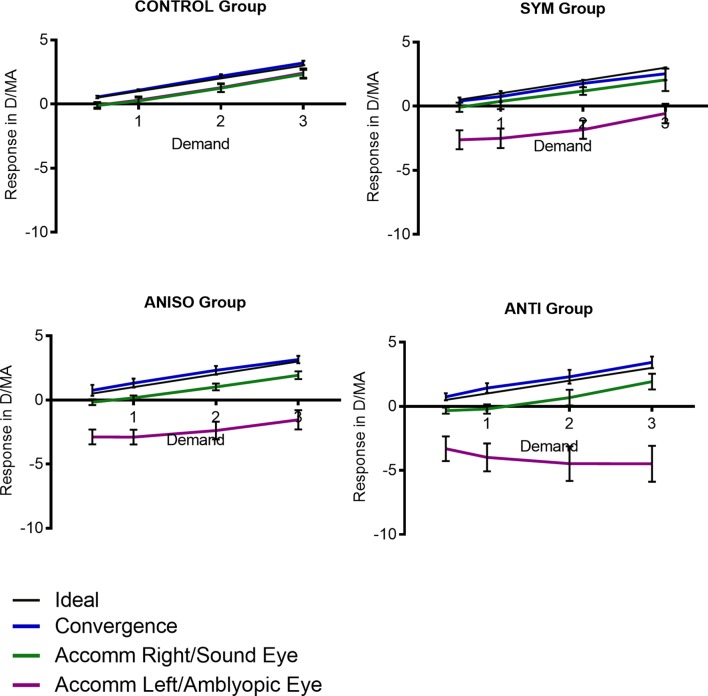
Figure 4.
Vergence and accommodation responses in the control group and each anisometropic group without glasses for demands of 0.5 D, 1 D, 2 D and 3 D. In all the graphs, the grey line represents an ideal response and the vergence response is in blue. In the control group, the green line and purple line represent the accommodation response of the right eye and the left eye, respectively. In the anisometropic groups, the green and purple lines represent the accommodation response in the sound eye and amblyopic eye respectively. Error bars denote ±95% CI. ANISO, aniso-accommodation; ANTI, anti-accommodation; SYM, symmetrical accommodation.

