
Figure 2.
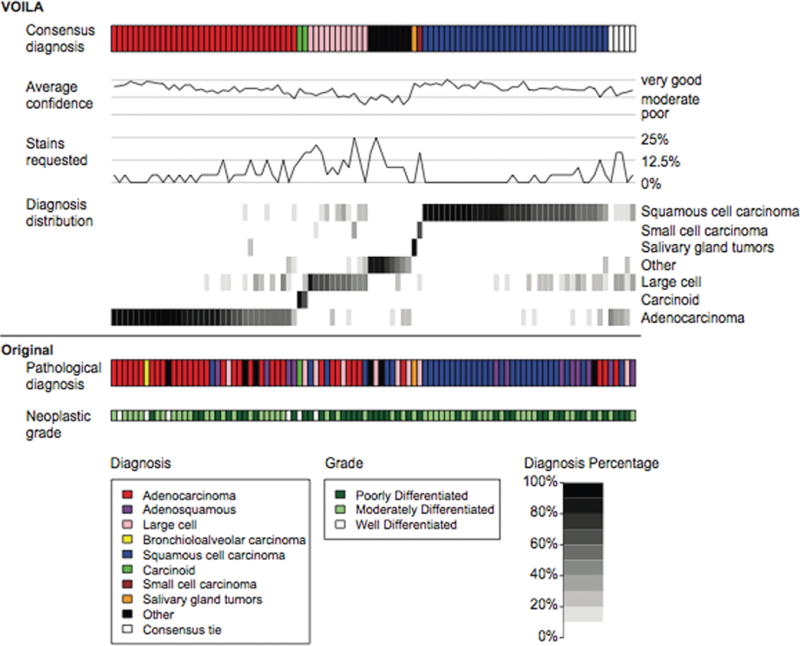
Each column of the figure corresponds to 1 of the 96 hematoxylin-eosin (H&E) slides. The top row shows study pathologist consensus (the majority) diagnosis. Average confidence and request for immunohistochemical stains across all reviewers are plotted as a function of the slides. Diagnosis distribution represents a heat map of the fraction of times any given 10 diagnostic-class (10DC) diagnosis was made for each of the 96 slides. The bottom 2 rows show the original pathologic diagnosis and the original neoplastic grade.