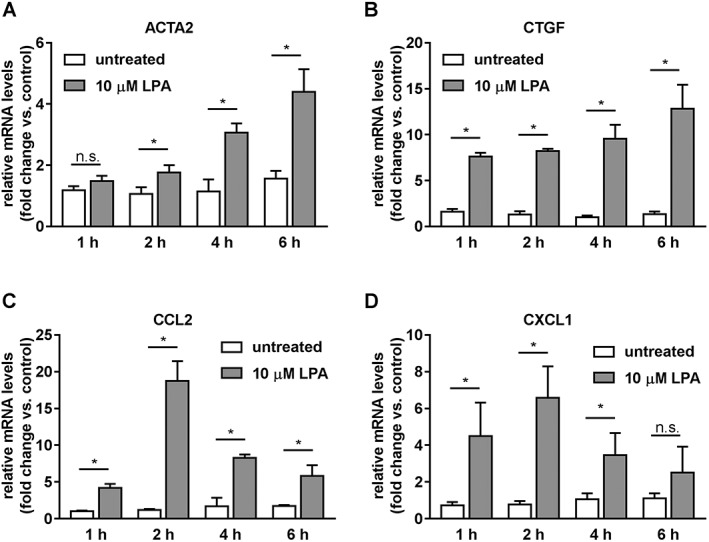
Figure 1.

Effect of LPA on expression of fibrosis and inflammation marker genes in primary human HSCs. (A) ACTA2. (B) CTGF. (C) CCL2. (D) CXCL1. Data represent relative mRNA levels normalized versus levels of RNA‐polymerase II and calculated as fold change compared to untreated samples at time zero. Data represent mean ± SD of one representative experiment (n = 6 samples per group, each measured in technical duplicate), *P < 0.05.
