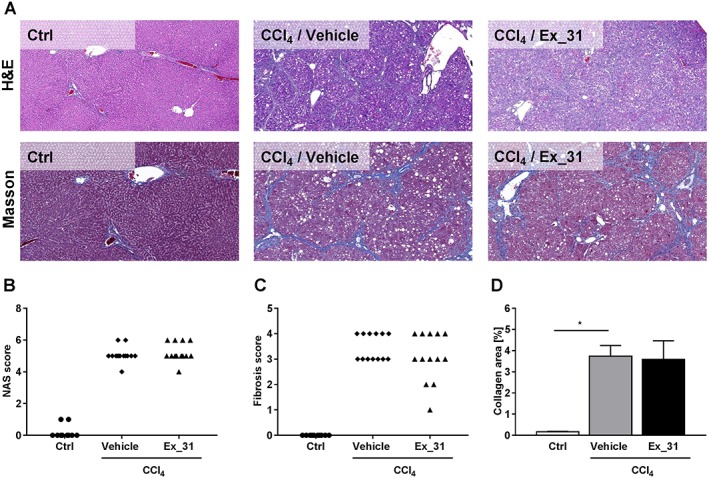
Figure 5.

Histology assessment of liver sections from control rats and from rats with CCl4‐induced liver injury. (A) Representative images of H&E stain and Masson's trichrome stain (Masson). (B) NAS. (C) Fibrosis scores. (D) Image‐based quantification of collagen‐positive area in Masson's trichrome‐stained liver sections. Data in (B) and (C) represent scores of individual animals. Data in (D) represent mean ± SEM, n = 10 [control (Ctrl)] and n = 13 (CCl4‐treated), *P < 0.05.
