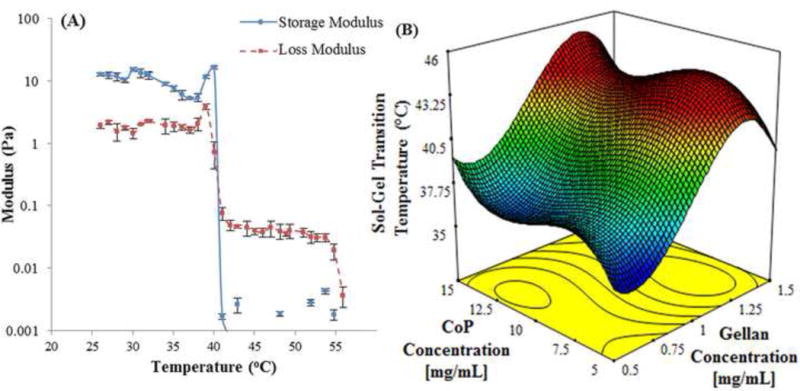
Fig. 2.

(A) Temperature scans for a mixture of 0.9 mg/mL thiolated gellan and 12 mg/mL poly(MAM-co-MAA-co-BMAC). (B) A modelled cubic surface plot of sol-gel transition temperature against concentration of thiolated gellan and copolymer in mg/mL.
 represents the gradient of colors with increasing transition temperature from 35.5 to 43 °C.
