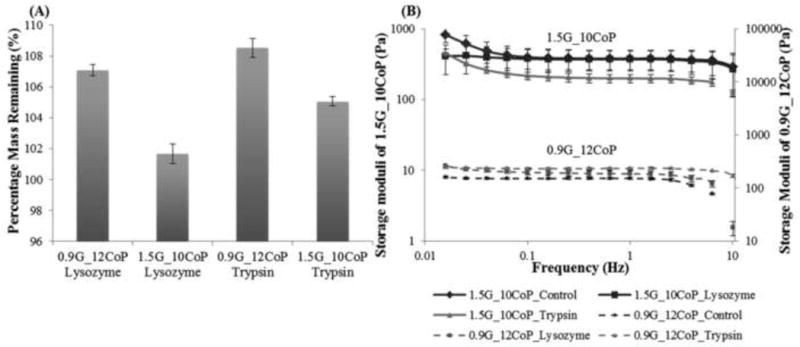
Fig. 8.

Degradation studies. (A) Percentage of mass remaining in the hydrogels 0.9G_12CoP and 1.5G_10CoP after 4 weeks in the presence of lysozyme and trypsin. (B) Storage moduli of 1.5G_10CoP and 0.9G_12CoP at different frequencies. Control is the hydrogel in 1× PBS. Storage moduli of 1.5G_10CoP is plotted in primary axis while 0.9G_12CoP in secondary axis. Error bars are the standard deviation from three replicates of each sample.
