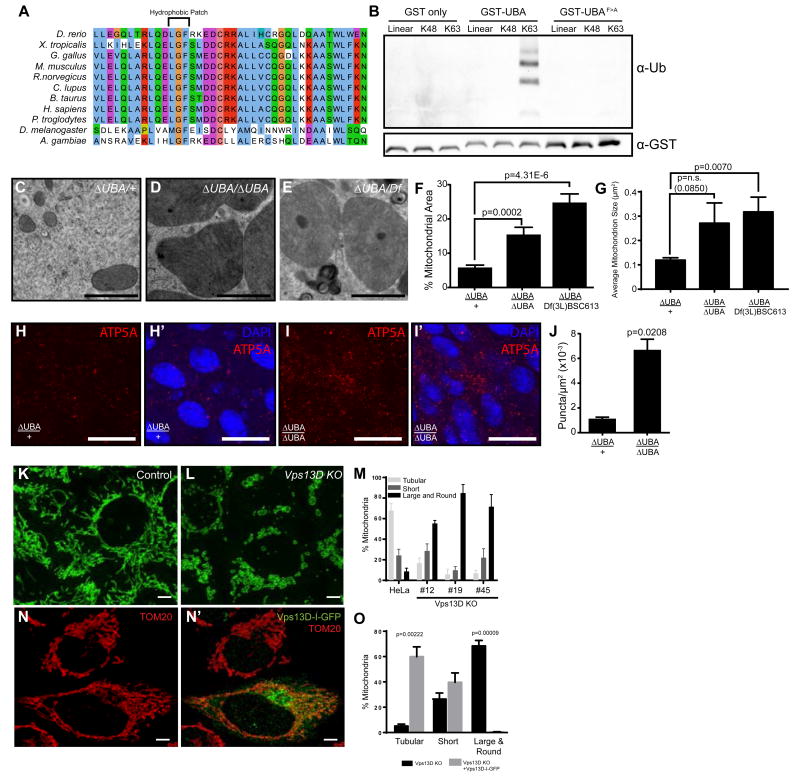
Figure 3. Vps13D ubiquitin binding is required for mitochondrial size in Drosophila and humans.
(A) Vps13D contains a UBA domain with a conserved hydrophobic patch known to mediate the interaction with poly-ubiquitin.
(B) Interaction of the Vps13D UBA domain or a phenylalanine to alanine mutant with tetra-ubiquitin chains. Results are representative of at least three binding assays.
(C) TEM highlighting the mitochondria of Vps13D UBA domain (∆UBA) heterozygous and (D) homozygous mutants as well as (E) Vps13D∆UBA/Df(3L)BSC613 midguts. Scale bars represent 1 μm.
(F) Percent area occupied by mitochondria and (G) average mitochondrion size quantitated from at least 5 fields from 3 intestines per sample.
(H-H’) ATP5A staining in Vps13D∆UBA/+ control guts 2 h after puparium formation. Results are representative of six biological replicates. Scale bars represent 25 μm.
(I-I’) ATP5A staining in Vps13D∆UBA/Vps13D∆UBA mutant guts 2 h after puparium formation. Results are representative of six biological replicates. Scale bars represent 25 μm.
(J) ATP5A staining is quantitated from 3 intestines each from heterozygous control and mutant midguts.
(K) TOM20 labeling of control and (L) Vps13D KO HeLa cells. Scale bars represent 5 μm.
(M) Quantitation of percent mitochondria representing tubular, short, or large and round phenotypes in control HeLa or Vps13D KO cell lines #12, #19 and #45. Results are representative of three biological replicates. For tubular mitochondria, P values are all <0.0001 for #12, #19 and #45 vs control HeLa. For short mitochondria, P=0.85, 0.07, 0.98 respectively for #12, #19 and #45 vs control HeLa. For large and round mitochondria, P values are all <0.0001 for #12, #19 and #45 vs control HeLa.
(N-N’) Vps13D tagged internally with GFP (Vps13D-I-GFP) rescues the large and round mitochondrial phenotype seen in Vps13D KO cells. Scale bars represent 5 μm. Results are quantitated in (O) and are representative of three biological replicates.
See also: Figures S3 and S4

