
Figure 4.
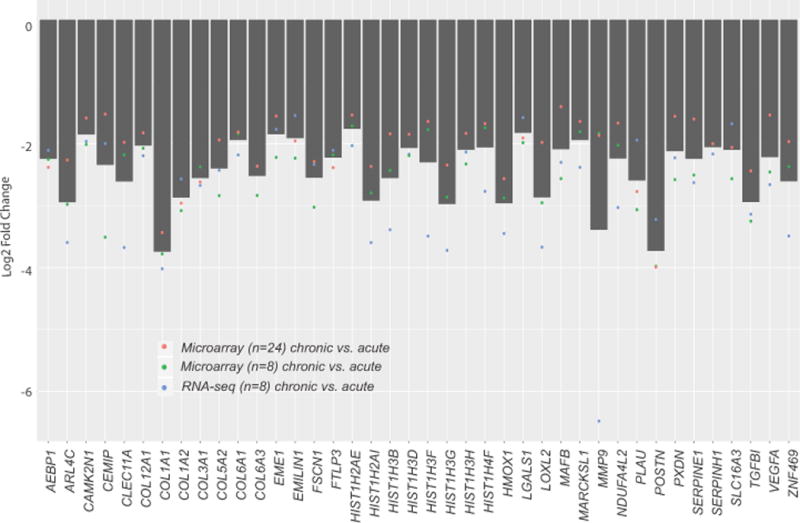
Barplot representing the mean log2 fold-change of 40 recurring genes across the N = 24 microarrays dataset, N = 8 microarrays dataset, and the N = 8 RNA-seq dataset. Individual points indicate the mean log2 fold-change for each dataset.
Official websites use .gov
A
.gov website belongs to an official
government organization in the United States.
Secure .gov websites use HTTPS
A lock (
) or https:// means you've safely
connected to the .gov website. Share sensitive
information only on official, secure websites.
Barplot representing the mean log2 fold-change of 40 recurring genes across the N = 24 microarrays dataset, N = 8 microarrays dataset, and the N = 8 RNA-seq dataset. Individual points indicate the mean log2 fold-change for each dataset.