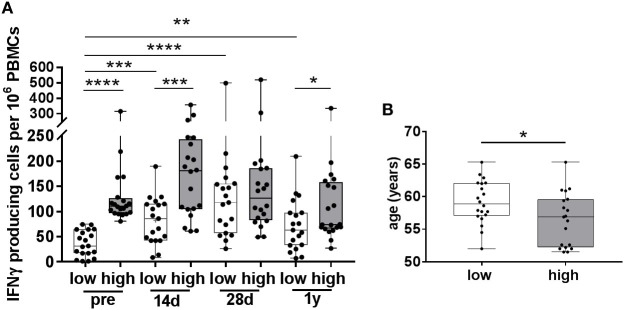
Figure 3.
Varicella zoster virus (VZV)-specific responses in participants with low and high pre-vaccination IFNγ-producing cells. (A) The number of VZV-specific IFNγ-producing cells, as measured by ELISpot, in participants with low (white boxplots, N = 19) and high (gray boxplots, N = 20) pre-vaccination IFNγ-producing cells. These groups were determined using the median number of pre-vaccination IFNγ-producing cells. Participants in the low pre-vaccination group possessed numbers of VZV-specific IFNγ-producing cells below the median, compared with numbers above the median in the high pre-vaccination group. (B) The age distribution of participants with low and high pre-vaccination IFNγ-producing cells. All boxplots are plotted from the min to max values with indication of the median. The low and high responders were compared with the Mann–Whitney U test. The different time points were compared with the Wilcoxon signed rank test preceded by the Friedman Test with correction for multiple testing. *p < 0.05, **p < 0.01, ***p < 0.001, and ****p < 0.0001.

