Figure 5.
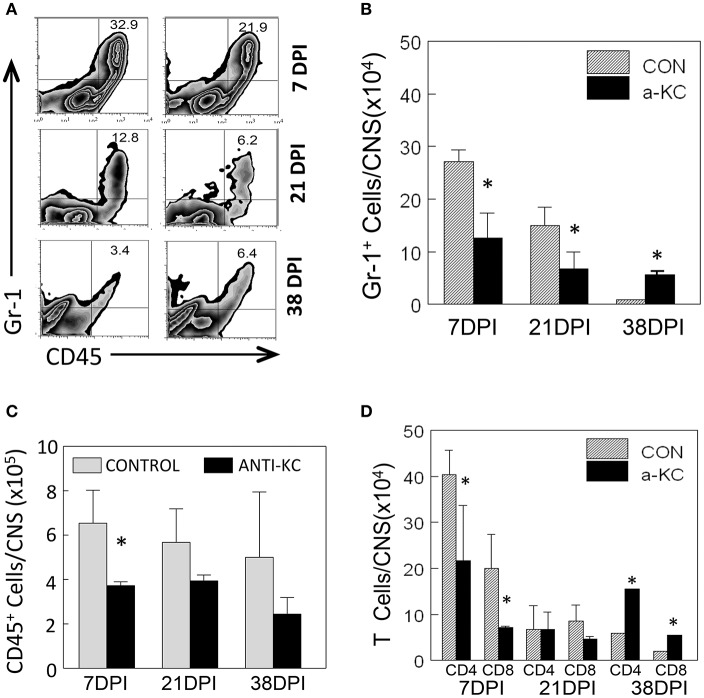
Cellular infiltration into the CNS of mice treated with anti-KC antibody and control mice. (A) The proportions of Gr-1+CD45+ neutrophils in the CNS of TMEV-infected mice treated with anti-KC and control antibodies were assessed using flow cytometry. (B) The numbers of Gr-1+CD45+ cells in mice treated with anti-KC antibody compared to control mice at early infection (7 dpi), during disease onset (21 dpi), and after the development of disease were assessed. The overall numbers of CD45+ cells (C) and CD4+ and CD8+ T cells (D) in the antibody-treated mice during the period of viral infection are shown. Values given are the means (± SD) of the results from 2 to 3 independent experiments. *p < 0.05.

