
Figure 6.
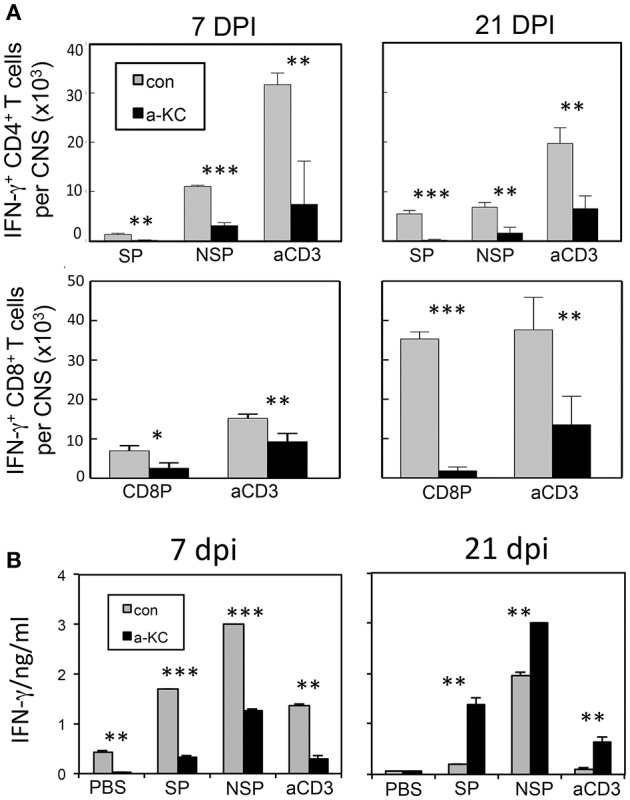
Analysis of CD4+ and CD8+ T cells that produce IFN-γ following infection with TMEV. (A) Mononuclear cells from the CNS of mice at 7 and 21 dpi were cultured for 6 h in the presence of PBS or a mixture of 1 μM of viral peptides and assessed the production of intracellular IFN-γ using flow cytometry. The data are representative of three independent experiments. (B) Splenocytes from mice at 7 and 21 dpi were cultured for 72 h in the presence of PBS, a mixture of 1 μM viral peptides or anti-CD3/CD28 antibodies. The production of IFN-γ in the culture supernatants were assessed using ELISA. Mixtures of CD4+ T cell-specific epitopes (SP mix; VP1233–250, VP274–86, and VP324–37; NSP mix, 3D6–23 and 3D20–38) and CD8 + T cell-specific epitopes (CD8 mix; VP3159–166, VP3173–181, and VP111–20) were used. Mixtures of plate-bound anti-CD3 and anti-CD28 antibodies (1 μg each) were used to stimulate pan-T cells. Values given are the means (± SD) of the results from triplicate wells. *p < 0.05; **p < 0.01; ***p < 0.001.