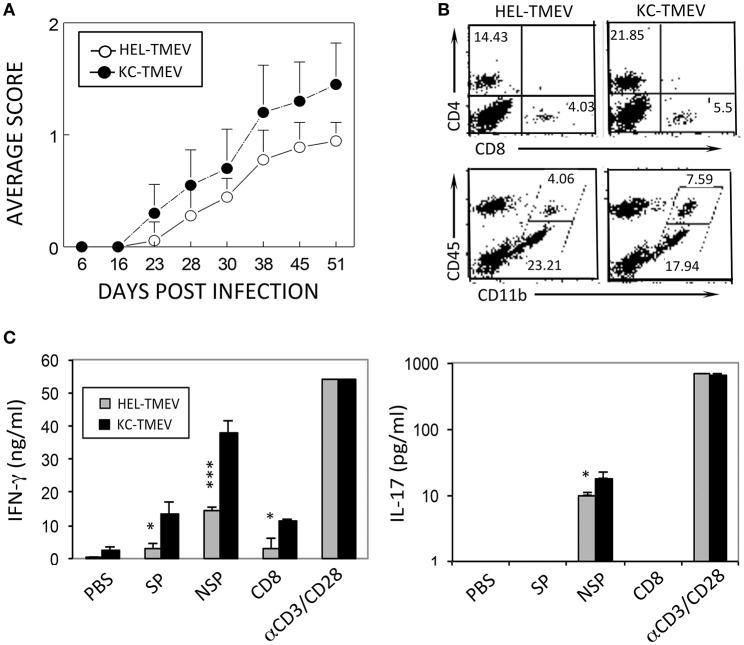
Figure 8.
Development of demyelinating disease and T cell responses after infection with KC-TMEV and control HEL-TMEV. (A) SJL mice were infected with KC-TMEV (n = 10) or control HEL-TMEV (n = 9). The animals were graded for clinical signs as described in the Materials and Methods section. The results are expressed as average clinical scores of animals at the indicated dpi. The two-tailed p-value of the two groups based on the paired t-test between 23 and 51 dpi was very significant (p < 0.0004). (B) Infiltration of CD4+ and CD8+ T cells and CD45+ CD11b+ cells into the CNS after infection with KC-TMEV or TMEV (4 dpi) was assessed using flow cytometry. The overall numbers of CD4+ T cells [(43.421 ± 6.585 vs. 11.339 ± 2.849) × 104] and macrophages [(10.627 ± 3.474 vs. 2.342 ± 1.426) × 104] infiltrated in the CNS of KC-TMEV infected mice were significantly higher than those of HEL-TMEV infected mice, respectively. (C) IFN-γ and IL-17 levels in the supernatants of the splenic cultures were determined using ELISA. Spleen cells were prepared 8 dpi from SJL mice infected with control HEL-TMEV (n = 3) or KC-TMEV (n = 3). Cells were cultured for 72 h in the presence of PBS or a mixture of 1 μM of the peptides. Mixtures of CD4+ T-cell-specific epitopes (SP mix; VP1233–250, VP274–86, and VP324–37; NSP mix, 3D6–23 and 3D20–38) and CD8+ T cell-specific epitopes (CD8 mix; VP3159–166, VP3173–181, and VP111–20) were used. αCD3/CD28 represents plate-bound anti-CD3 and anti-CD28 antibodies (1 μg each) used to stimulate pan-T cells. The culture supernatants were subsequently collected for ELISA. The data are representative of three independent experiments. Values given are the means (± SD) of the results from triplicate wells. *p < 0.05; ***p < 0.001.

