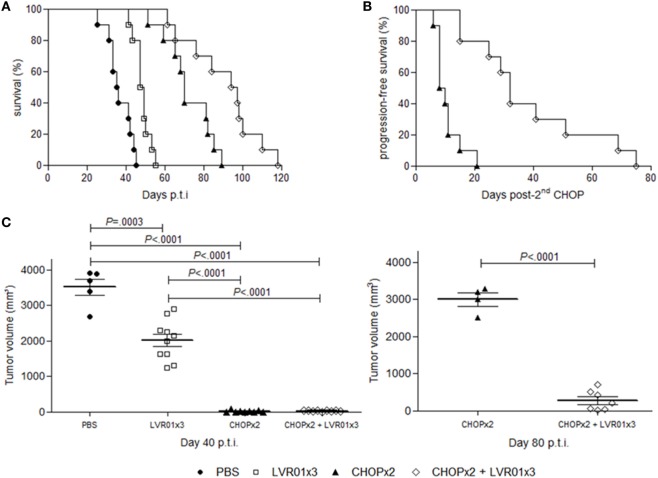
Figure 2.
Survival curves and tumor growth. (A) Kaplan–Meier plot of mice survival post-tumor challenge. Overall survival was followed up for 120 days (n = 10). Significant differences were observed between all groups (log-rank, P < 0.0001). (B) Progression-free survival post-second CHOP. Significant differences were observed between groups (log-rank, P < 0.0001). (C) Tumor volume (mm3) at day 40 p.t.i. for all groups and 80 p.t.i. for two cycles of CHOP (CHOPx2) and CHOPx2 + LVR01x3 groups. Each dot represents one individual animal. Mean and SD are also depicted. At day 40 p.t.i., significant differences were observed between all groups (P < 0.0001, analysis of variance), except groups treated with chemotherapy, for which significant differences are observed at day 80 p.t.i. (P < 0.0001, Student’s t-test).

