FIGURE 2.

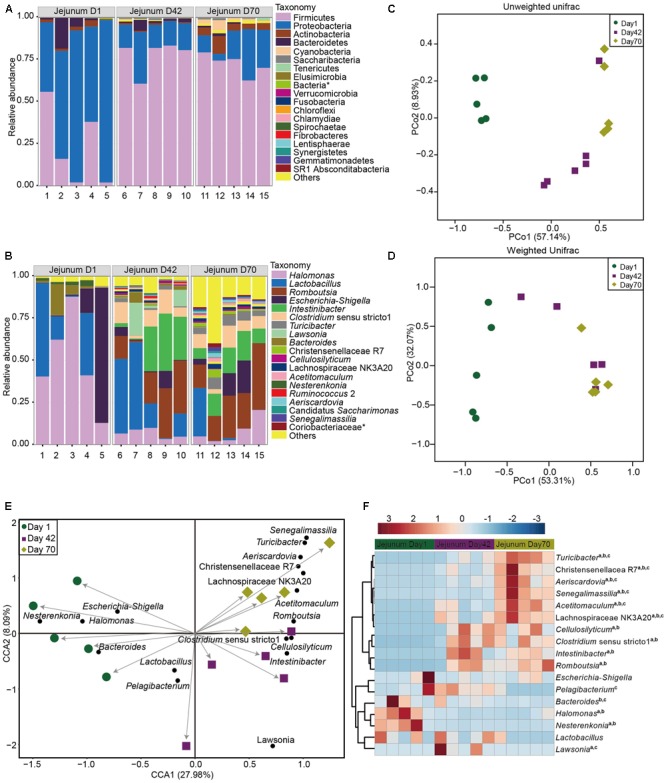
Microbial community composition in the jejunum of sika deer across three time points. Taxonomic composition at the phylum (A) and genus levels (B). Principal coordinate analysis (PCoA) of jejunum microbiota based on unweighted unifrac (C) and weighted unifrac distance (D). Canonical correlation analysis (CCA) (E) and heatmap (F) showing the significant taxa of jejunum across three time points. a, b, c indicate the significance between days 1 and 42, between days 42 and 70, and days 42 and 70, respectively. The asterisk means the unclassified bacteria at the family or phylum levels.
