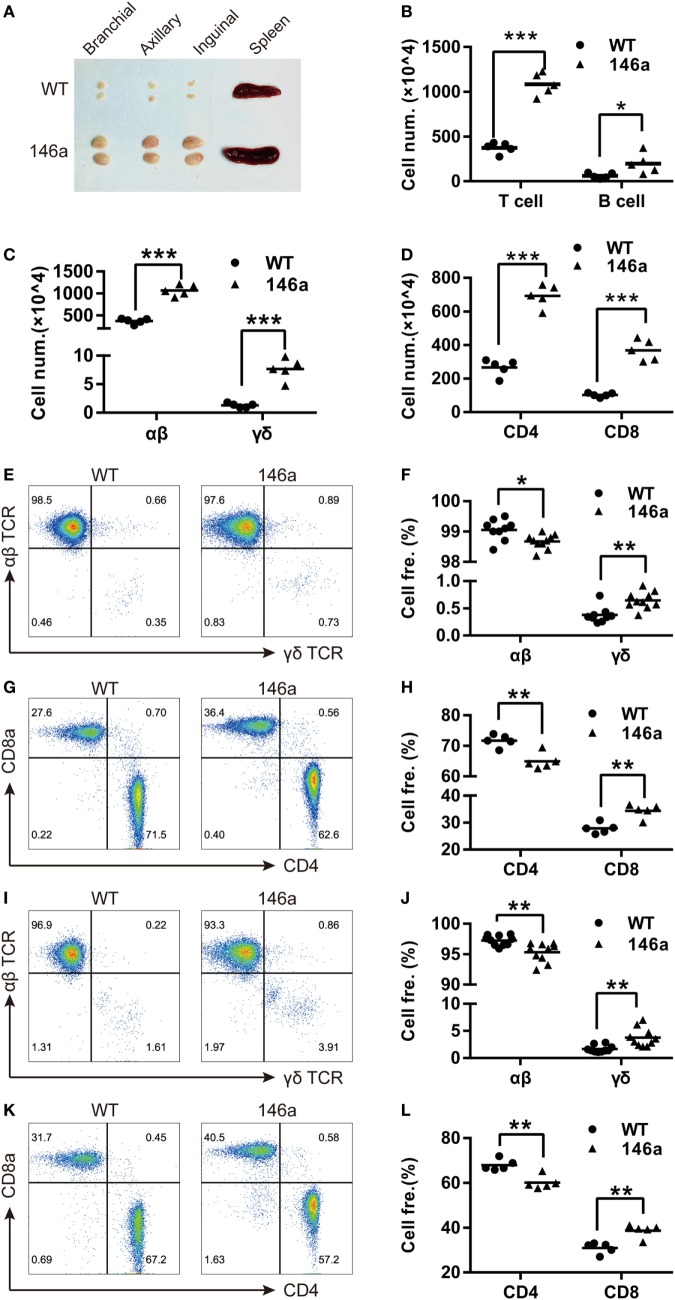
Figure 1.
miR-146a transgenic (Tg) mice show splenomegaly and lymphadenopathy. (A) Bilateral inguinal, axillary, and brachial lymph nodes (LNs) and spleens were isolated from 7-week-old female miR-146a Tg (bottom) or wild-type (WT) (top) mice. (B–D) Flow cytometry (FCM) analysis of T cells and B cells (B), αβ/γδ T cells (C), and CD4+/8+ T cells (D) from the LNs of miR-146a Tg or gender- and age-matched WT mice. (E–H) FCM analysis of the proportions of αβ/γδ T cells (E,F) and CD4+/CD8+ T cells (G,H) in LNs from miR-146a Tg and WT mice. (I–L) FCM analysis of the proportions of αβ/γδ T cells (I,J) and CD4+/CD8+ T cells (K,L) in spleens from miR-146a Tg and WT mice. Each dot represents one mouse, and the values represent the mean ± SD. Statistical significance is indicated as follows: *P < 0.05, **P < 0.01, ***P < 0.001 (Holm–Sidak method).

