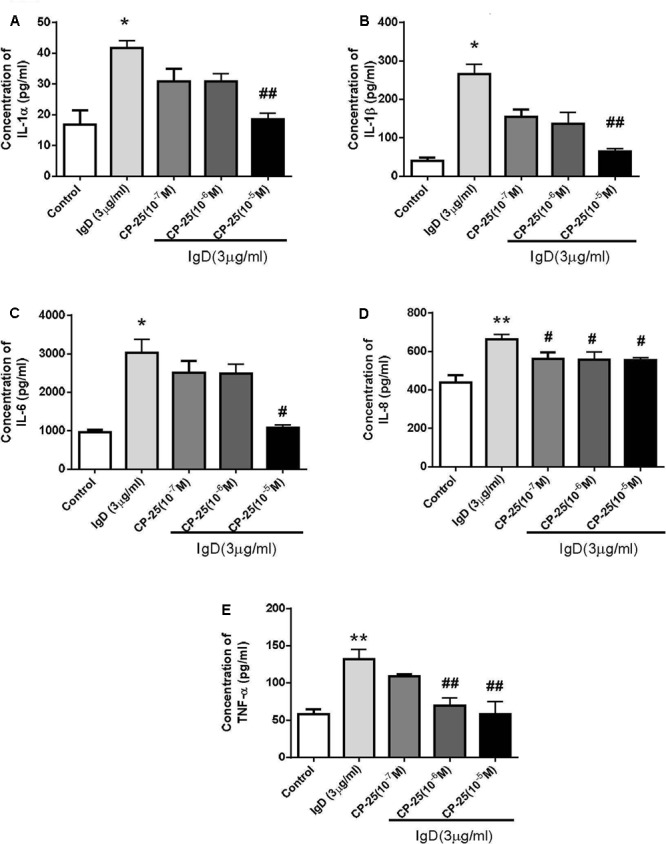
FIGURE 7.

Variation in inflammatory cytokine secretion by human CD4+ T cells stimulated by immunoglobulin D (IgD) and the effect of CP-25. Cell culture supernatants were collected after treated with IgD (3 μg/ml) and CP-25 (10-7∼10-5 mol/l) for 24 h. The glass slide was scanned using a microarray scanner, and levels of IL-1α (A), IL-1β (B), IL-6 (C), IL-8 (D), and TNF-α (E) were measured. Data are expressed as the mean ± standard error of the mean (n = 4). ∗P < 0.05, ∗∗P < 0.01 vs. control; #P < 0.05, ##P < 0.01 vs. IgD group.
