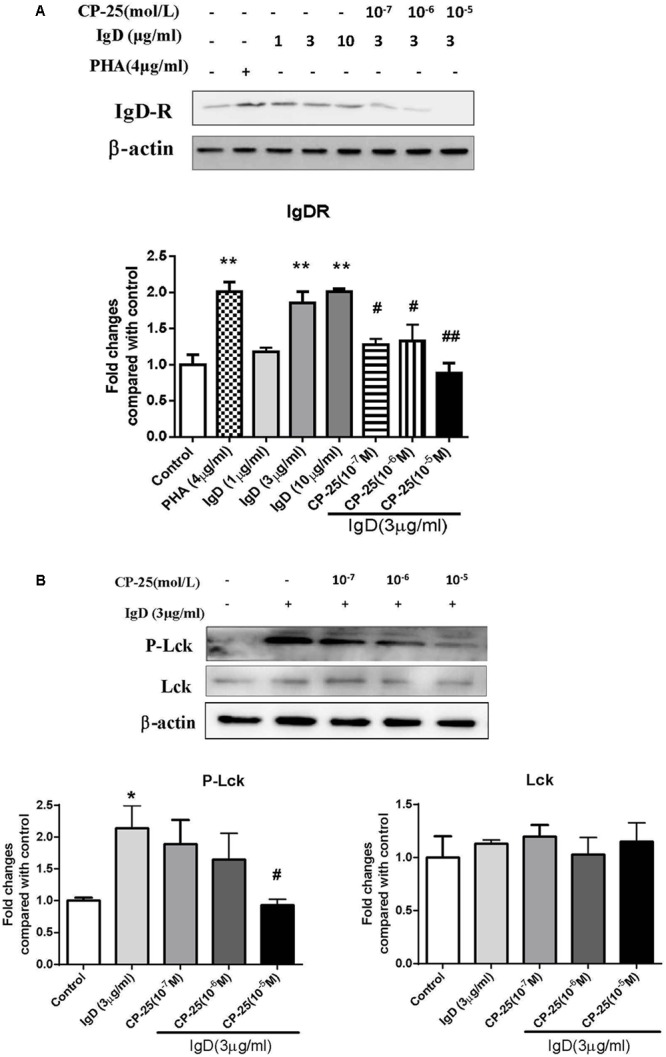
FIGURE 8.

Effects of CP-25 on the expression of immunoglobulin D receptor (IgDR) and Lck in human CD4+ T cells stimulated with immunoglobulin D (IgD). CD4+ cells were treated with IgD (3 μg/ml) and CP-25 (10-7∼10-5 mol/l) for 24 h and lysed. (A) Western blot analysis of IgDR expression in CD4+ T cells. (B) Western blot analysis of Lck and P-Lck expression in CD4+ T cells. Data are expressed as the mean ± standard error of the mean (n = 3). ∗P < 0.05, ∗∗P < 0.01 vs. control; #P < 0.05, ##P < 0.01 vs. IgD (3 μg/ml) group.
