
FIGURE 1.
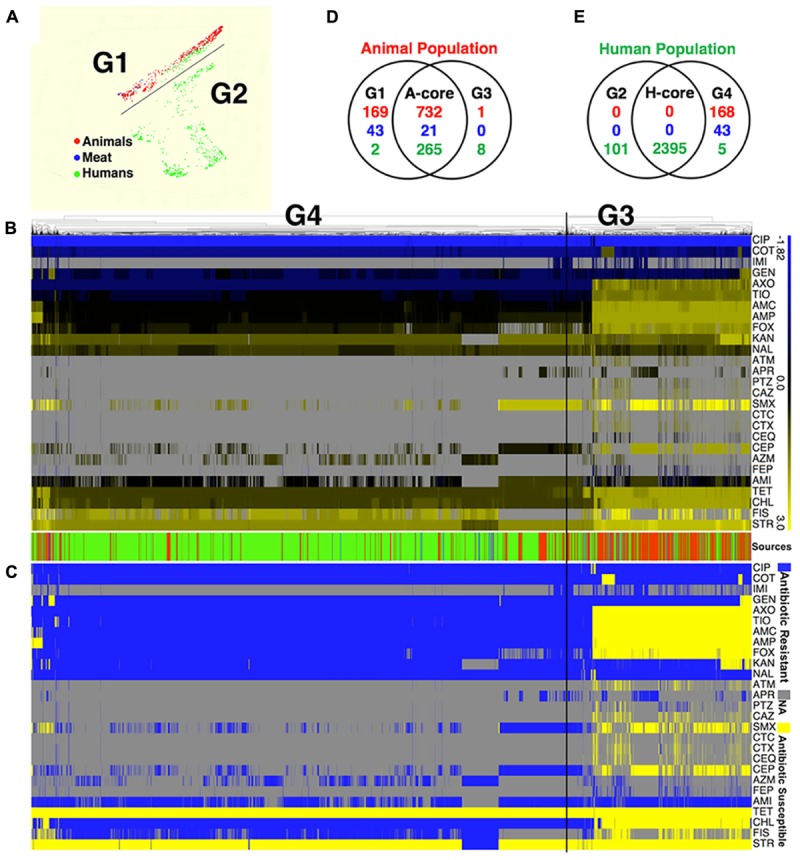
The population diversity of 3728 S. Newport isolates, sampling from human, bovine, porcine, chicken, and turkey. (A) Population diversity of S. Newport grouped in multidimensional scaling plot by RandomForest. The MIC value of 27 examined antibiotics for each strains were used to group different population. Two distinct population, G1 and G2, were detected. Each dot represents individual isolate, with colors indicating host origins. (B) Population diversity of S. Newport grouped by hierarchical clustering. A hierarchical tree with 200 bootstrapping, by using the MIC value of 27 antibiotics, was used to group different population. Two distinct population, G3 (left) and G4 (right), were detected. The color of heatmap, from blue (–1.82) to yellow (3), shows the log value of MIC of individual isolate for each antibiotic. The color of sources (last row) shows the origin of individual strain, with red (animal), blue (meat), and green (human); gray color indicates strains without MIC value. The source bar is shared by (B,C). (C) The antibiogram for individual strains are shown, with yellow indicating the susceptibility, and blue indicating the resistance, based on the MICs interpreted by the CLSI-2015 standards. Gray color indicates strains without MIC value. (D) The Venn diagram for correlation of animal-core group (red) by two animal population G1 and G3. Animal core group is defined as the cluster of those isolates that have been derived from the samples originating in the live animals or animal meat. (E) The Venn diagram for correlation of human-core group (green) by two human population G2 and G4. Human core group is defined as the cluster of those isolates originating from the human samples. For the details on the antibiotics used in the MIC as well the corresponding abbreviations shown in this figure, please refer to Table 1.