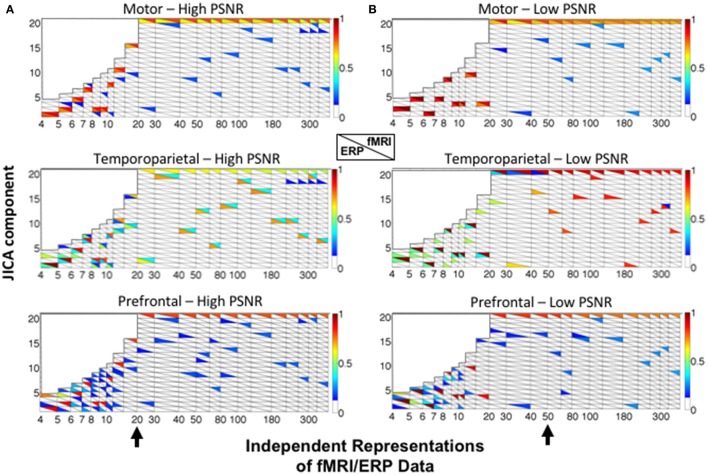
Figure 5.
JICA source segregation with a linear relationship between fMRI and ERP activity in a parametric experimental design. JICA source detection values for ERP and fMRI (lower and upper triangles, respectively) of the motor (top panels), temporoparietal (middle panels) and prefrontal (lower panels) sources are shown for (A) high (ERP = 10.9; fMRI = 16.6 dB) and (B) low (ERP =−8.6; fMRI= −2 dB) PNSR. For the prefrontal source, ERP source detection values were calculated with respect to the spatially nearest (temporoparietal) source. The black arrow (bottom panels) indicates the number of independent representations of the ERP/fMRI data beyond which motor and temporoparietal ERP sources were separated into different components. The color bar denotes the source detection values of the original sources recovered in each component (p < 0.05 threshold).

