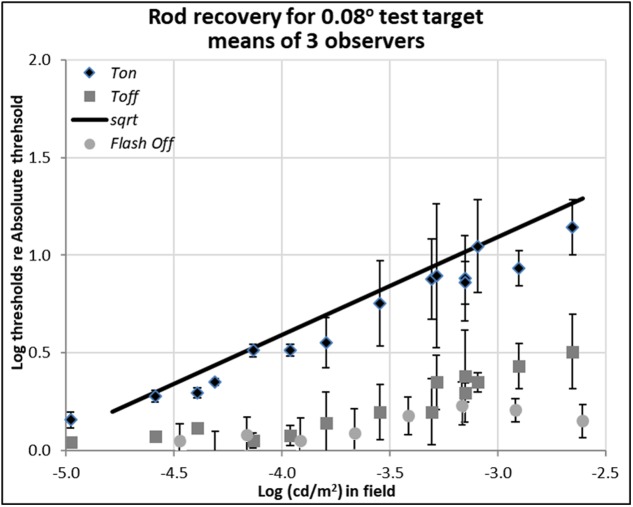
FIGURE 2.
Plots of rod thresholds for detecting a small target (0.08°), either on a steady field (Ton) or 600 ms (Toff) or 200 ms (Toff-flash) in darkness, relative to Tabs. Thresholds were averaged over three observers and are plotted as a function of log (cd/m2) in the background field. Bars denote ± 1 standard error of the mean. Solid black line indicates the square-root prediction.

