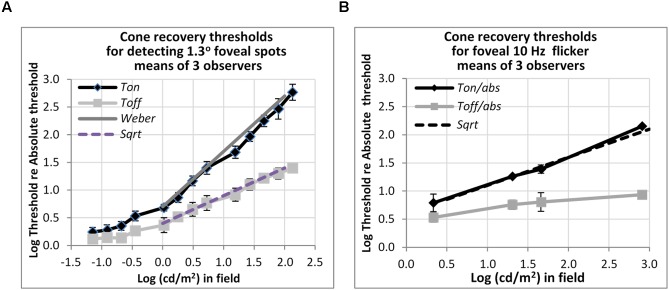
FIGURE 5.
Plots of cone thresholds for (A) detecting a larger (1.3°) non-flickering target and (B) flickering target (10 Hz). Thresholds were averaged over three observers, and plotted as a function of cd/m2 in the background field. Continuous and dotted straight lines show the Weber and square-root predictions for Ton and Toff, respectively. Note that ‘abs’ here refers to the absolute threshold of the cones, not that of the rods, and corresponds (for the 1.3° test) to the dotted line shown in Figure 3.

