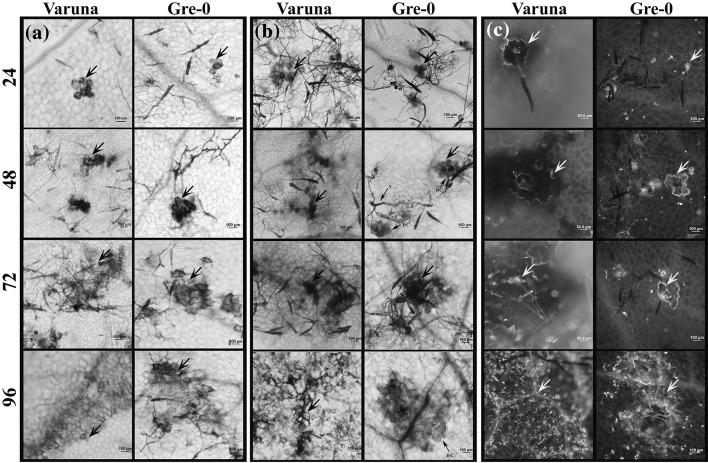
Fig. 3.
Hydrogen peroxide accumulation, cell death and callose deposition in Gre-0 and Varuna in response to A. brassicae infection. Representative pictures of inoculated leaf samples collected at 24, 48, 72 and 96 hpi were assayed for H2O2 accumulation (arrow) (a); cell death (arrow) (b) and callose deposition (blue fluorescence, yellow arrow) (c). The production of H2O2, cell death and callose deposition are restricted to a few cells during the early phases. Their spread tightly correlates with spread of the disease symptoms

