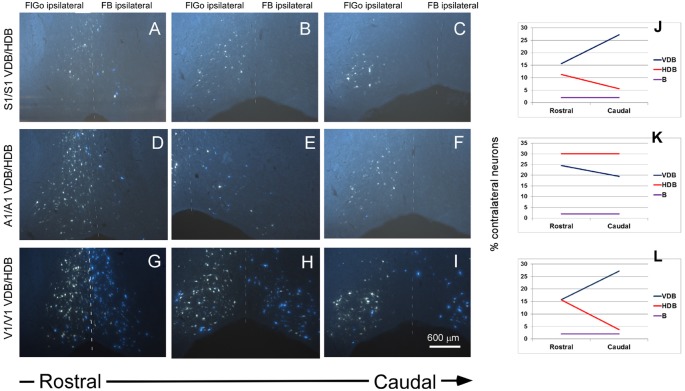
Figure 4.
Fluorescent microscope images showing the rostro-caudal distribution of fluorescent labeled neurons. (A–C) Fluorescent microscope images from animals injected with FlGo and FB in S1. (D–F) Fluorescent microscope images from animals injected with FlGo in A1 and FB deposit in A1. (G–I) Fluorescent microscope images from animals injected with FlGo in V1 and FB deposit in V1. (J–L) Graphic representation of rostro-caudal distribution of neurons in VDB, HDB and B nucleus and the proportion of contralateral labeled neurons.

