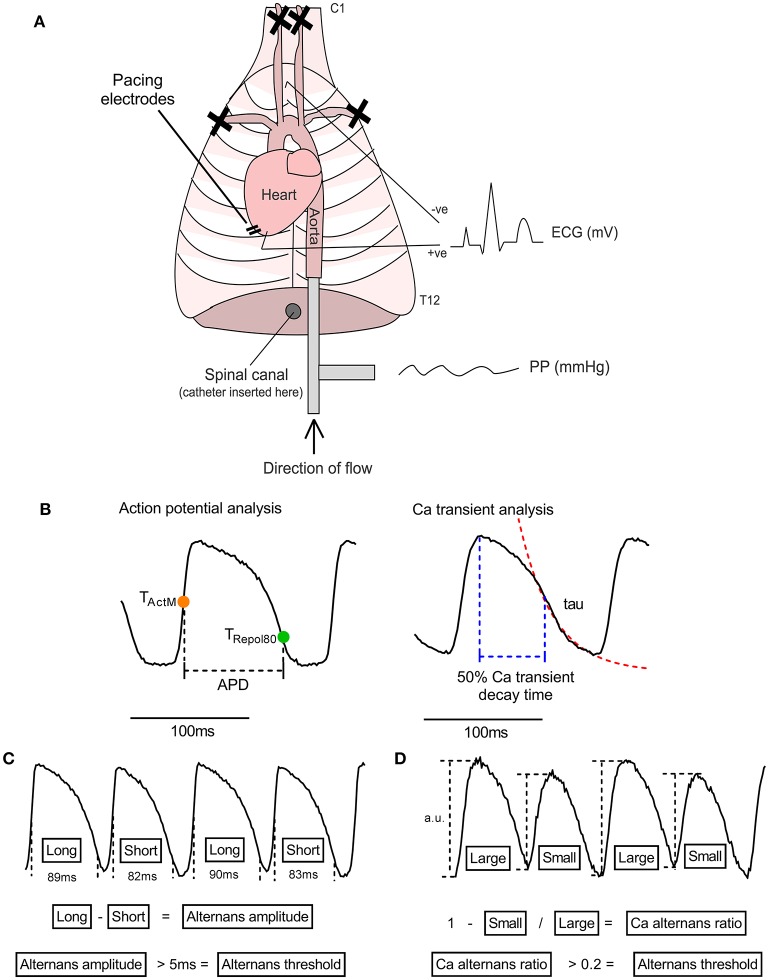
Figure 1.
The isolated innervated guinea pig heart. (A) Illustrative representation of the isolated innervated guinea pig heart model. See text for details. PP, perfusion pressure; ECG, electrocardiogram. (B) Illustration of analysis parameters used for action potential and Ca transient recordings. Action potential duration (APD) was measured as the period between activation (midpoint of upstroke, TActM) and 80% repolarisation (TRepol80). The rapid decay phase of the Ca transient was fitted to exponential function to derive the time constant (tau). Ca transient decay time was measured from peak of the Ca transient to 50% recovery. (C,D) Data analysis protocols for action potential and Ca transient amplitude alternans. For action potential duration, the maximum-minimum difference between pairs of beats is taken as the amplitude of alternans and the threshold for detection is set to 5 ms. For Ca transient alternans, the relative amplitude of the intracellular Ca transient, measured from the baseline preceding each beat, was used to calculate a Ca alternans ratio (see Equation 1). 0.1 is used as the threshold for Ca recordings.

