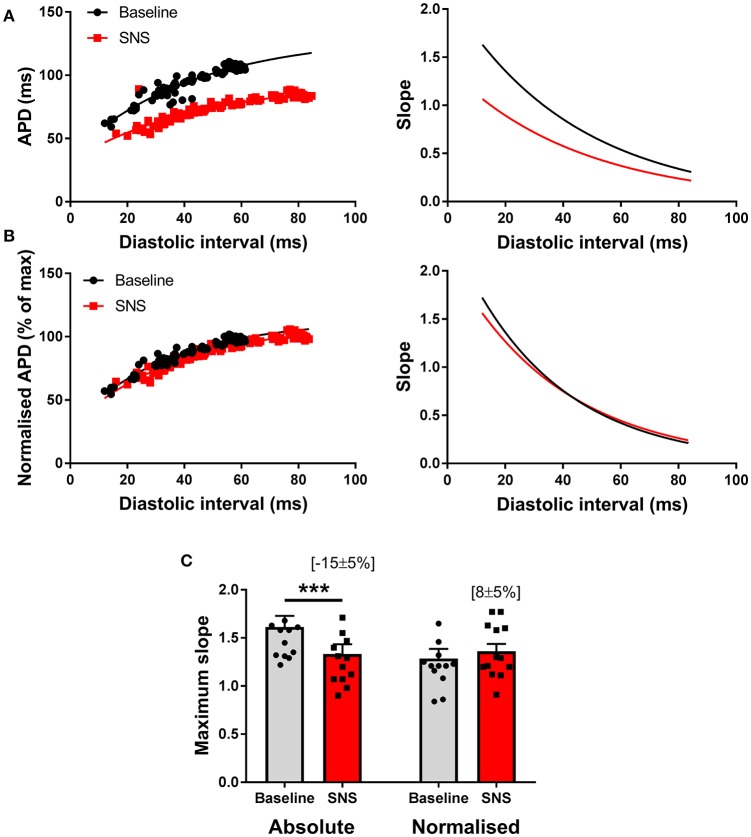
Figure 5.
Modulation of the electrical restitution curve by sympathetic nerve stimulation. (A) Representative action potential duration (APD) restitution curves at baseline and during sympathetic nerve stimulation (SNS). The right panels show the first derivative of the exponential fit of each curve. (B) The same data with normalization to the maximum APD of each curve and the associated first derivative. (C) Data showing the effects of SNS on maximum slope of the APD restitution curve with and without normalization to account for differences in APD between conditions. Data represent mean ± SEM. Two-way ANOVA, with Tukey's post-hoc tests; ***p < 0.001. (n = 13 hearts).

